/ Software Engineering Intelligence /
The intelligence layer for agentic software delivery
AI made coding fast, but you can't tell whether it’s improving delivery or inflating costs.
Allstacks makes sense of your agentic software delivery, grounded in actual activity, with agents to surface risk, measure AI impact, and recommend optimizations.


.avif)
/ impact /
32
%
Faster cycle time
3
x
Focus on strategic work
70
%
Fewer bugs in early months
25
%
Faster pull-request response

/ how it works /
INputs
Connect.
Connect to your tool stack across project, code, delivery, collaboration and documentation.

Allstacks
Contextualize.
Allstacks normalizes and enriches your complete historical data set to create meaningful signals you can act on

Outputs
Ask.
Continuous investigation and insights surfaced across delivery risk, AI tool impact, capacity allocation, and team flow.


/ capabilities /

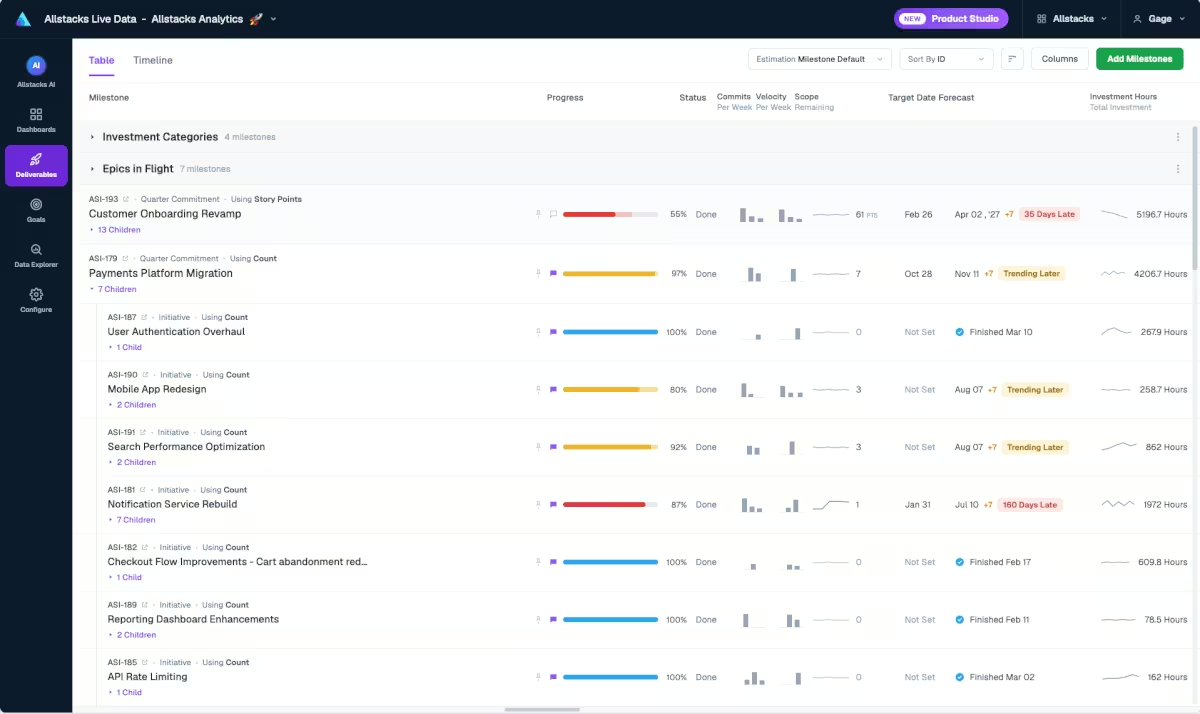
Continuous delivery risk detection.
Agents investigate every initiative, surface risks weeks before a potential delay, and trace root causes across teams and tools.
Predictive delivery forecasting.
Intelligence built on your team's actual history to forecast completion dates, flag capacity risks, and run scenarios before you're out of runway.
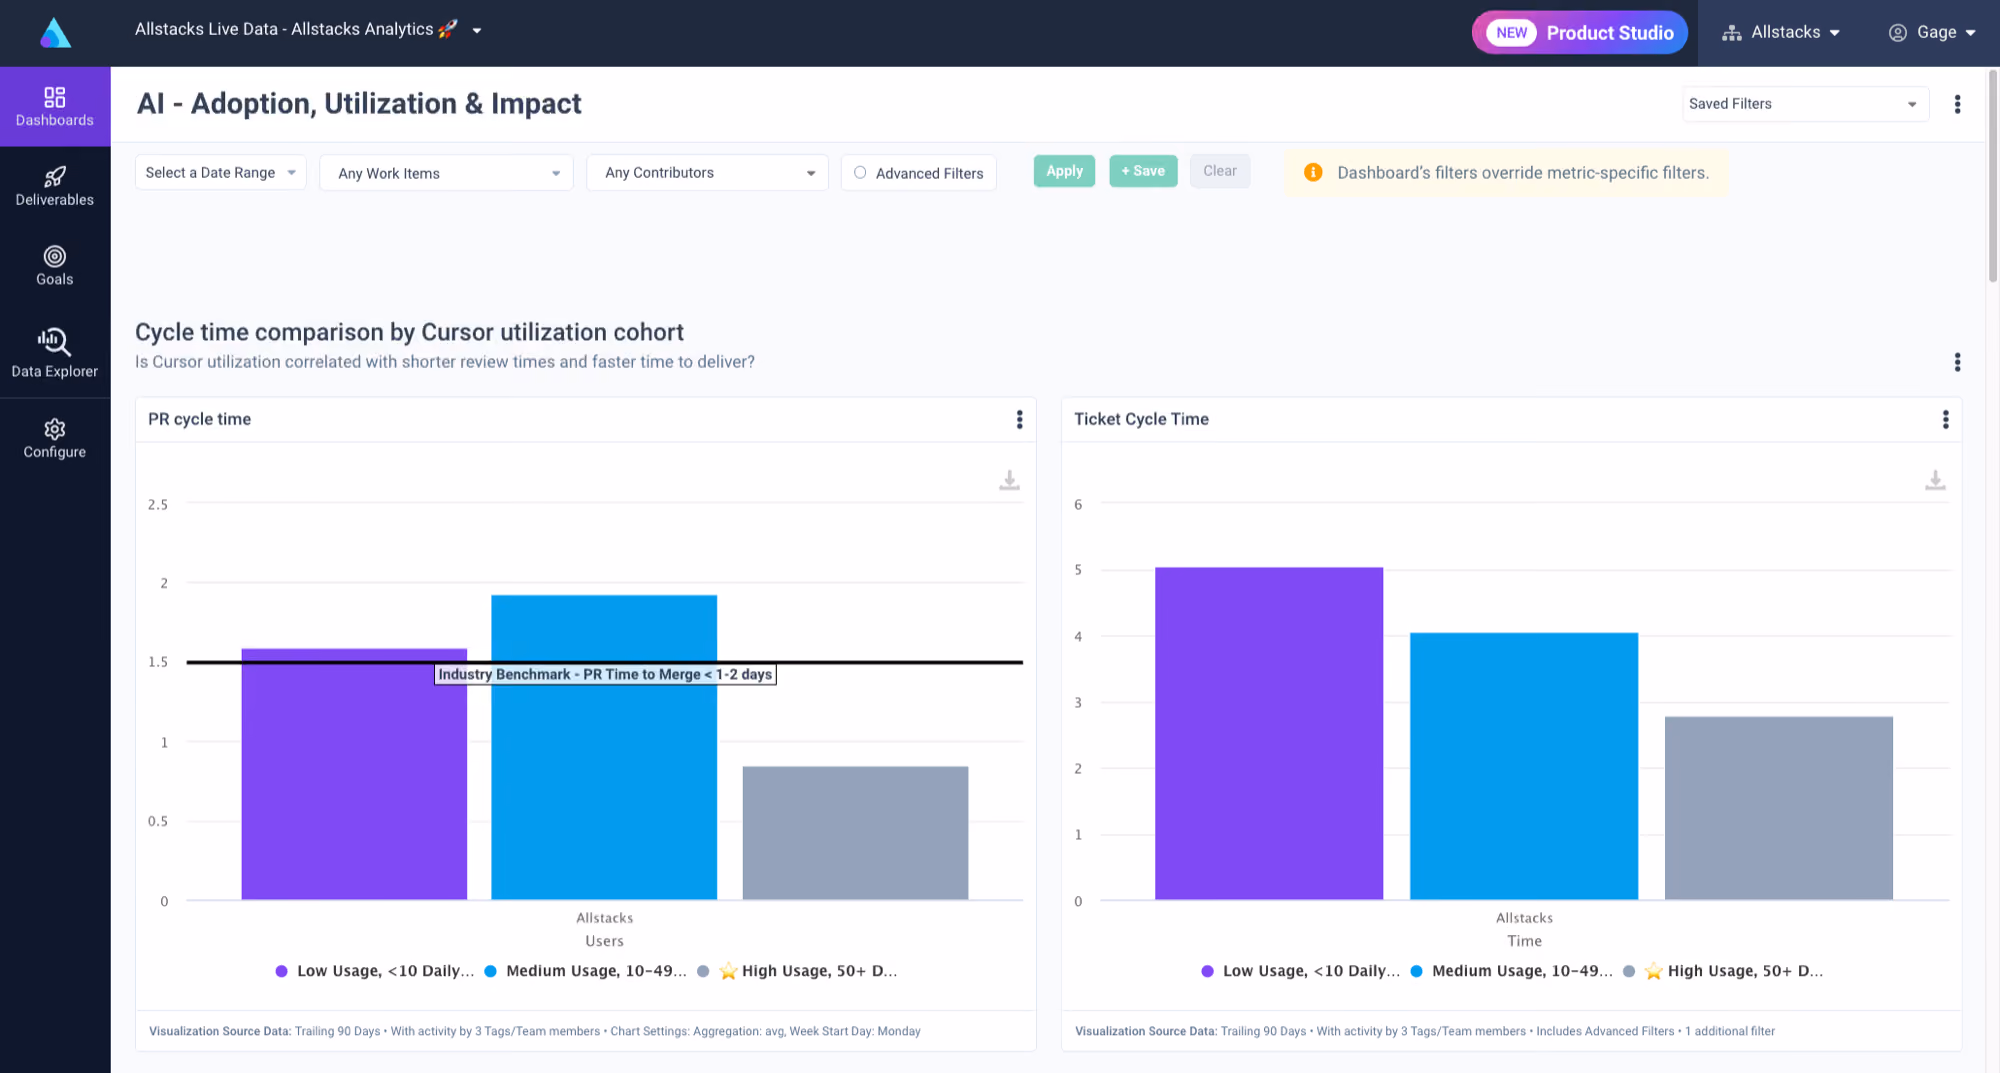
AI tool ROI measurement.
Correlate AI tool adoption to key performance metrics such as cycle time, defect rates, and throughput across teams for the data behind "is this investment working?"
Engineering performance analytics.
DORA, Flow, and SPACE metrics are normalized across your data, so you have one consistent performance picture without manual aggregation or brittle spreadsheets.
Developer experience and surveys.
Combine pulse surveys with delivery activity to measure cognitive load, flow state, and team health alongside the delivery metrics that explain them.
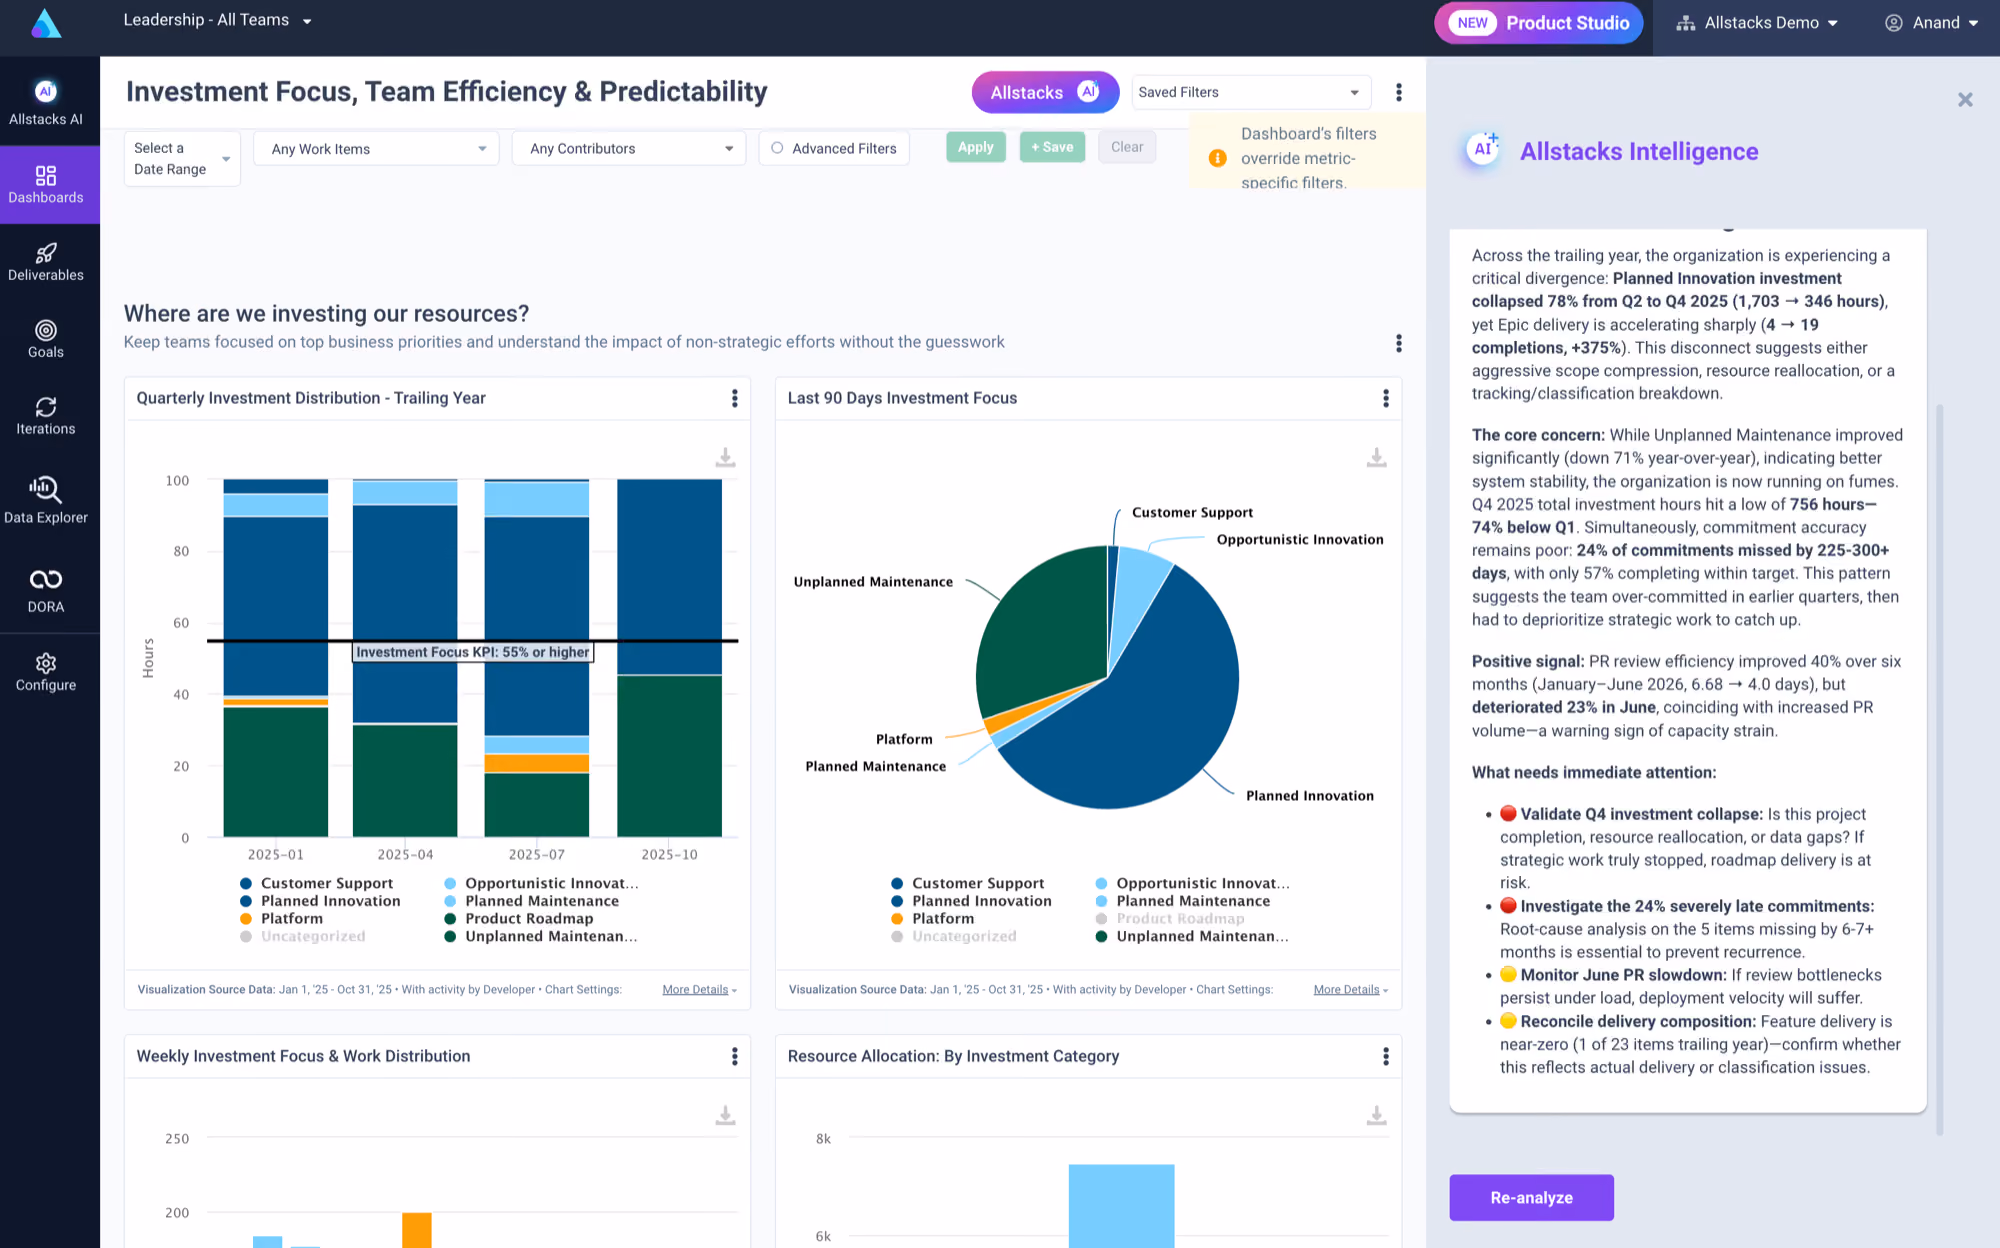
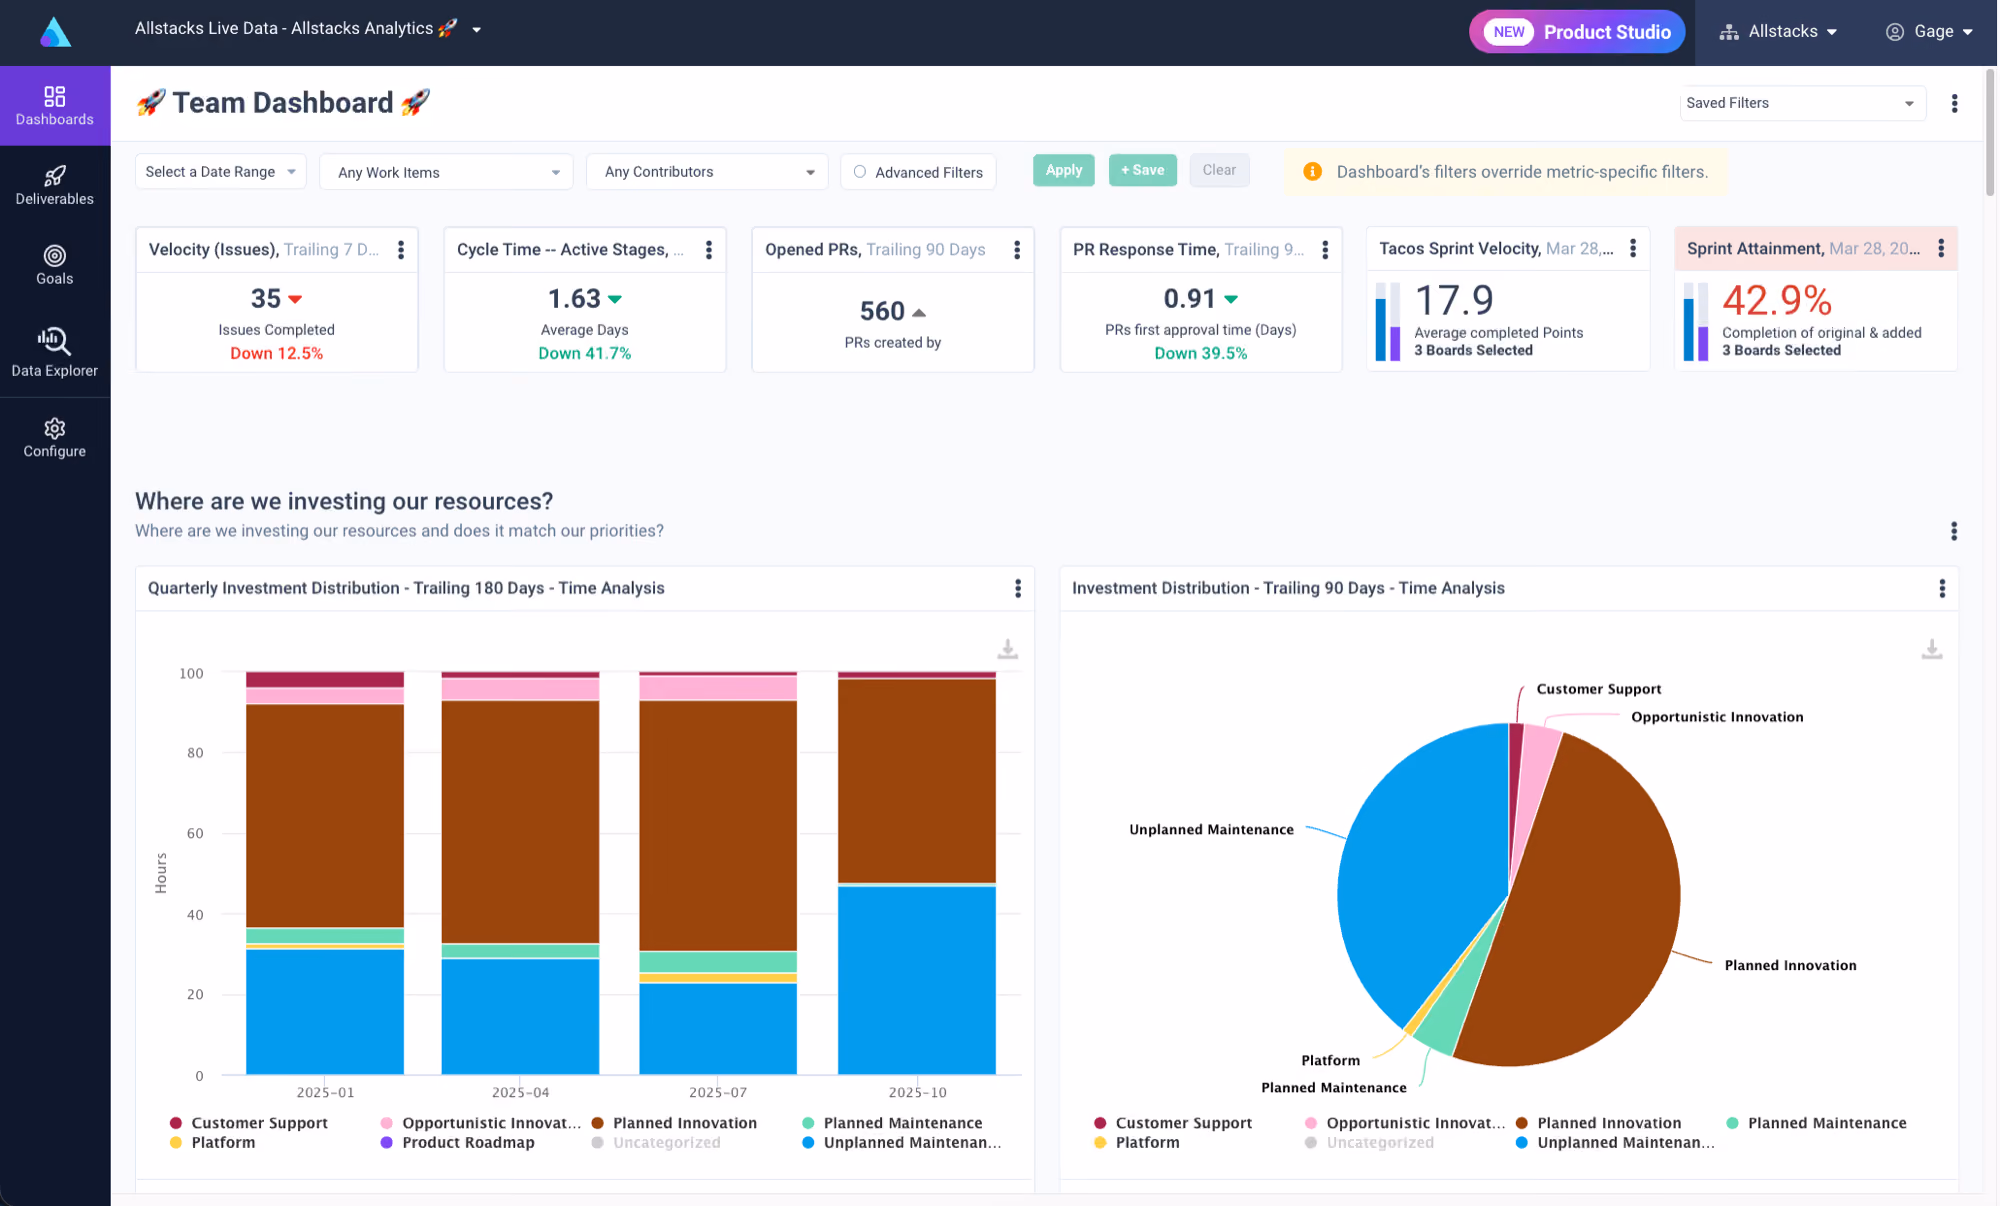
Portfolio and investment reporting.
Map engineer hours to initiatives and strategic vs. KTLO work, and generate the board-ready financial view your CFO needs.
/ see it /
/ use cases /
Manage delivery risk.
Surface delays and dependencies before they become missed commitments.
Improve engineering performance.
Industry benchmarks and workflow-driven recommendations.
Align investment to initiatives.
Match where engineering time goes to what's actually planned.
Measure AI coding impact.
AI tool and token usage correlated with delivery metrics and costs to understand impacts
Automate software cost capitalization.
Audit-ready capitalization reports from development activity, no timesheets.
Measure developer productivity.
Productivity, output quality, and developer experience in one view.
/ customers /

/ question & answers /
What does Allstacks offer over Jira or other native reporting tools?
Native reporting tools typically only surface data from one system and lack the signals from actual code commits. Allstacks correlates 30-plus tools, normalizes and enriches them through the Context Graph, and runs agents that surface delivery risk and root cause automatically.
How is Allstacks different from BI tools?
BI tools require you to build and maintain every query and dashboard. Allstacks ships pre-built with SDLC-specific models, delivery forecasts, and agents that surface actionable insight without custom setup.
What metrics does Allstacks measure?
DORA, Flow, and SPACE metrics across all connected tools; delivery forecasts; AI coding tool adoption and impact; developer experience scores; and investment allocation and R&D capitalization. Allstacks measures 130+ metrics natively with the ability to configure and customize what metrics you want to see through our data explorer.
What does Allstacks connect to?
Thirty-plus tools across the PDLC and SDLC: Jira, GitHub, GitLab, Azure DevOps, Linear, CI/CD pipelines, Slack, Confluence, GitHub Copilot, Cursor, and more. Connections auto-refresh with no manual sync required.
How does Allstacks calculate costs?
Allstacks maps actual development activity to initiatives and applies your labor rates, classifying work as capitalizable R&D, strategic, or operational.
/ get started /