
Product Update | What’s New | May 2025
In this month’s update:


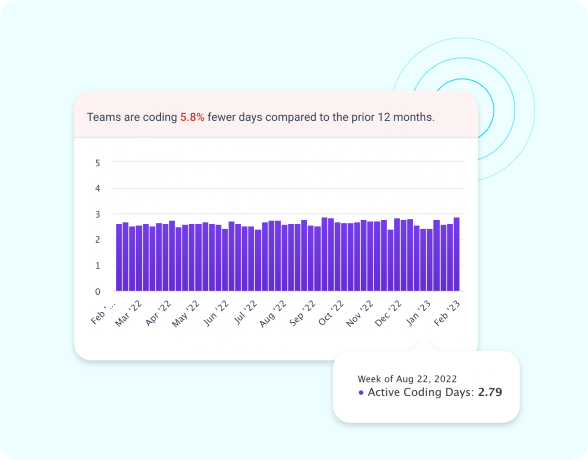
Allstacks keeps tabs on all the important stuff, so you don't have to. Track performance metrics and KPIs in easy-to-read dashboards—you'll always know where you stand and where you're headed with Allstacks guiding the way.

/Group%202431.svg)
/Ellipse%2091-1.png?width=123&height=123&name=Ellipse%2091-1.png)
/Path%20299-1.png?width=116&height=110&name=Path%20299-1.png)
Get the insights you need to optimize performance and deliver on time with Allstacks'
performance metrics and KPIs. Understand your SDLC, track progress using the framework of
your choice, and make data-driven decisions to drive success.

/pexels-thisisengineering-3861958.png?width=1366&height=761&name=pexels-thisisengineering-3861958.png)
/Group%201387_slider.svg)
/Group%201387_4.svg)
/Polygon%2069.png?width=115&height=111&name=Polygon%2069.png)
/Path%20299.png?width=123&height=131&name=Path%20299.png)
/Ellipse%2091.png?width=76&height=76&name=Ellipse%2091.png)
Customizable dashboards and real-time alerts provide crystal
clear visibility into your team's performance. No more guessing
games or blind spots—just helpful insights you can use to figure
out which processes are working, and which ones aren’t.
/Group%202357.png?width=588&height=460&name=Group%202357.png)
Zoom in on problem areas and solve them faster than ever with Allstacks sounding the alarm on issues like increased response time, lags in life cycle, and slowdowns in work patterns as soon as they arise—not whenever they happen to be noticed.
/Group%202358.png?width=588&height=460&name=Group%202358.png)
Allstacks' customizable KPI dashboards keep you laser-focused
on the work that matters by providing context into how your
team's activities align with your business goals, so you can stay
on the right track to ensure the best possible outcomes.
In this month’s update:
But this approach is not without friction: engineers balk at submitting timesheets, managers question the accuracy of the data, and accountants worry...
For years, engineering leaders have turned to the four DORA metrics—deployment frequency, change lead time, change failure rate, and mean time to...

/Risk_Assisstent_page_convo.png)
Dalia Havens, VP of Engineering, Netlify
Operationalize your engineering data and evaluate your progress using pertinent KPIs and performance metrics. Schedule a demo today, and see how Allstacks can make a difference for your organization.
Discover how Allstacks can take your software organization to the next level.

Get a risk-free trial of our value stream intelligence platform—no strings attached!

/StrategicPlanning_BestEstimatedROI_Roi.png?width=770&height=1000&name=StrategicPlanning_BestEstimatedROI_Roi.png)
/SoftwareDevelopmentAnalyticsTools_HighPerformer_HighPerformer.png?width=770&height=1000&name=SoftwareDevelopmentAnalyticsTools_HighPerformer_HighPerformer.png)
/SoftwareDevelopmentAnalyticsTools_HighPerformer_Mid-Market_HighPerformer.png?width=770&height=1000&name=SoftwareDevelopmentAnalyticsTools_HighPerformer_Mid-Market_HighPerformer.png)