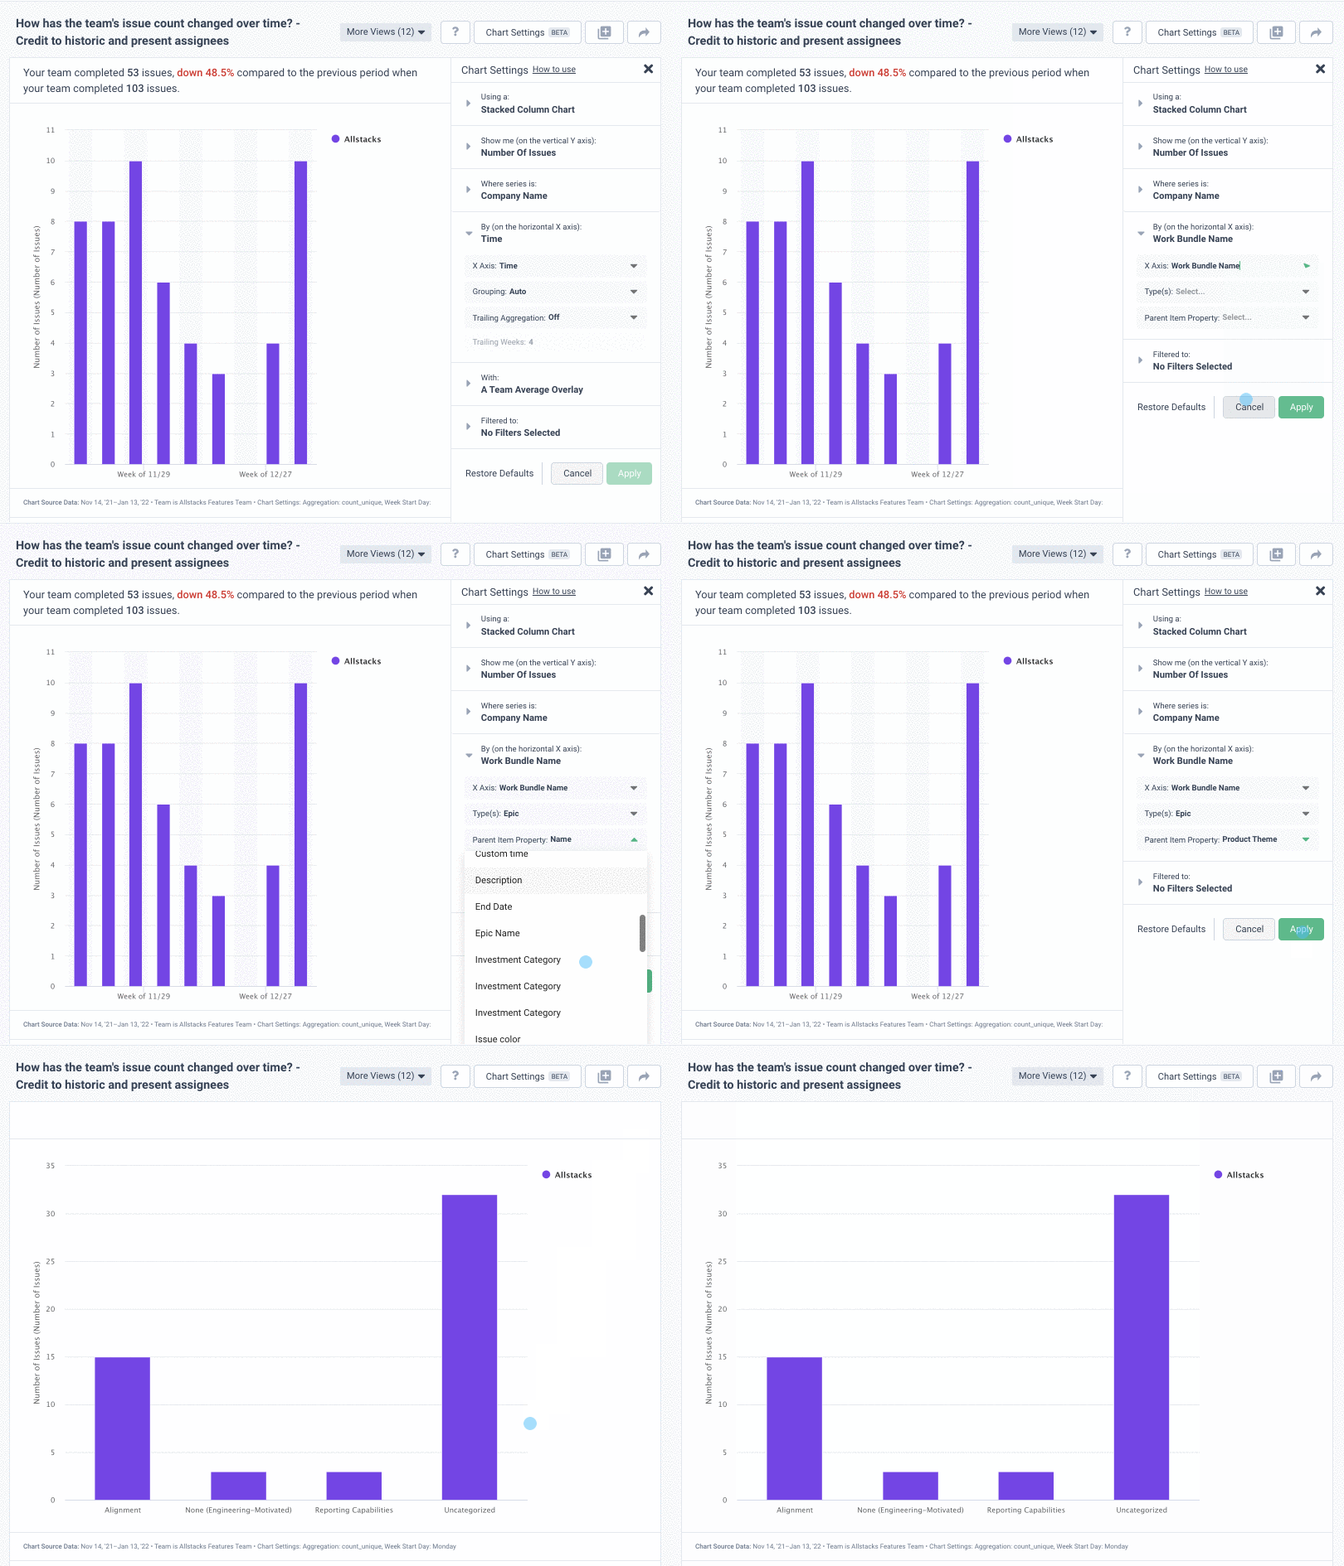
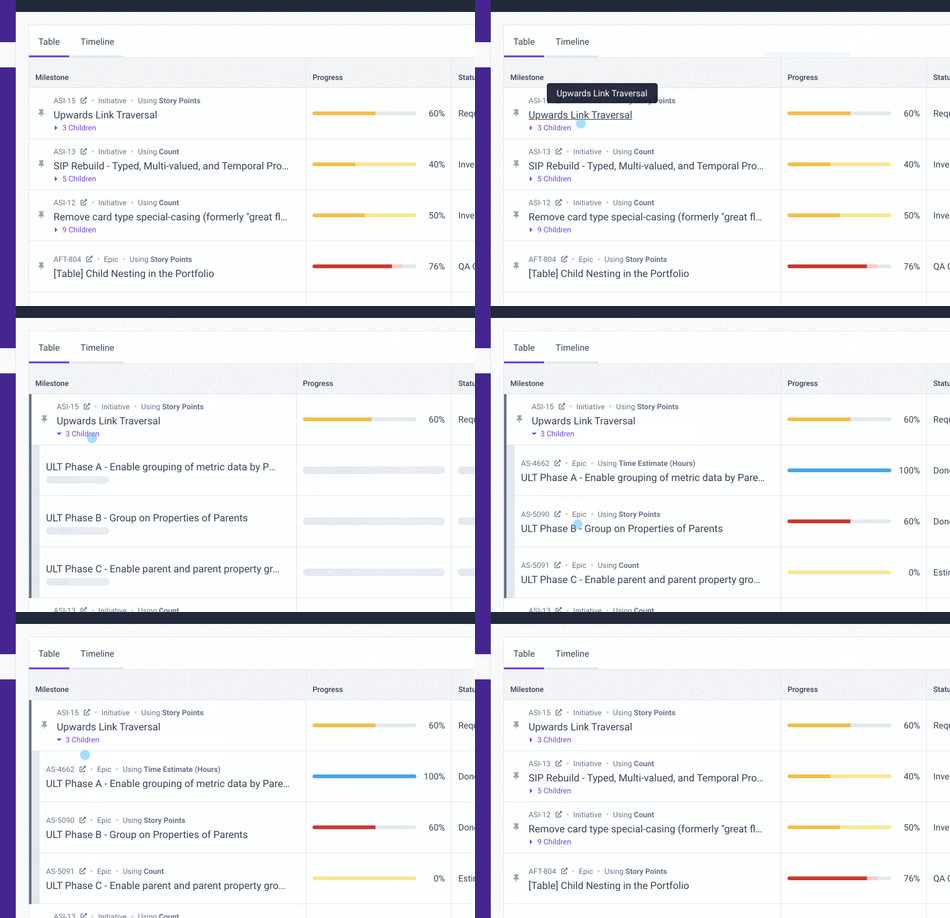
Well, our users asked and we answered! Allstacks has released updates to support the exploration of data through the ability to group data on reports and parent/child linking on the Portfolio Report.
Custom data grouping on metrics
Rolling up team activity to meaningful thematic groups is basically impossible in most tools. Allstacks changes that. Now you can customize your charts by grouping code and issue activity by the properties or fields on their parents.
Now you can see activity grouped into investment categories, feature groups, clients, components, product areas, and of course, custom JIRA fields.

Child nesting on the Portfolio Report
The Portfolio Report gives you an at-a-glance view of the initiatives you care about the most. Often, you end up pinning a lot of child projects of those initiatives that you want to track the progress of as well.
When you go to the Portfolio Report, you will see the child projects nested under parent items which means you can pin fewer items, reduce maintenance, and have better visibility across all those projects.

Learn more about the Portfolio Report here.
Since we're talking about metrics, do you know how your team stacks up against the first-ever Engineering Performance Industry Benchmarks?

Written By:


