


Last July - (Allstacks Viewpoint - 7/24) we wrote about the perspective of "if you can't measure it, you can't manage it” (Peter Drucker). From an Allstacks view we will always advocate for data informed decision making. Over time though one observation we continue to make is that the “Numbers” leaders look at continue to be based primarily on quantitative measures, under the heading of - those are the numbers that never lie!
Let’s combine the raw data with the viewpoints of the developers in your team has never rung truer when it comes to engineering metrics in today's fast-paced technology landscape.
Let’s be clear, if you aren't measuring ALL key factors, you simply can’t lead and manage properly - period! Implementing the right metrics strategy requires being intentional about what you track while also ensuring it can adapt as situations evolve.
First - there is no one-size-fits-all set of metrics that works across companies and product lifecycles. The metrics you prioritize should directly align with your current goals and objectives. Are you focused on increasing efficiency? Then cycle time and deployment frequency may be paramount. Launching a new product? User adoption, engagement, and revenue metrics take precedence over pure engineering output.
Here are some good metrics to start with:
Chart 1: Investment by Initiative

This is a view of the initiatives worked the past 30 days. This gives us a summary view as to whether the teams and organization are in alignment with the focus of the team toward organizational objectives.
Chart 2: Deployment Frequency
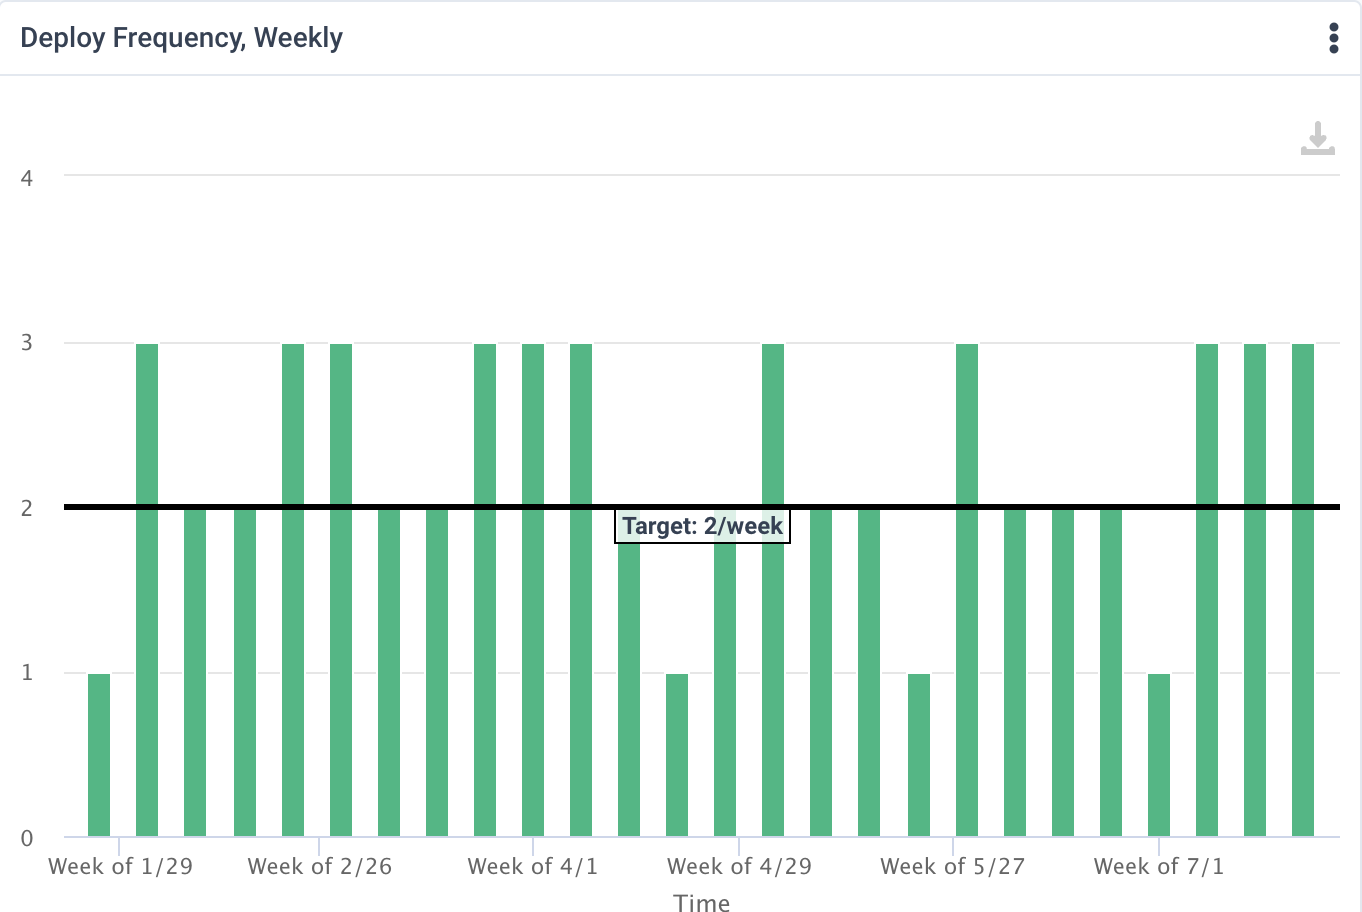
This is deployment frequency - the target is 2 per week. The actual is closer to 3 recently, indicating more frequent and smaller deployments. This is a net positive Dora behavior.
Regardless of the specific metrics, less is often more. Aim to identify your 4-6 key focal metrics for any given period rather than attempting to measure everything. This focused approach prevents overwhelming your team with too much data. It also allows you to be more deliberate about what you intend to actively monitor and manage towards.
When selecting metrics, look for areas of natural tension or friction. For example, balancing speed of delivery (deployment frequency) against quality (change failure) or sprint attainment (commit vs complete) vs. sprint stability (limited in sprint changes). This balanced approach ensures you aren't optimizing for one factor like speed to the detriment of other critical components like a stable product experience.
Chart 3: Cycle Time

This is representative of total cycle time by work stage for tickets. The target for this team is to complete 1 ⁄ 2 of all work in less than 5 days and to have the remaining 1 ⁄ 2 of the work evenly distributed to the second week - keeping the progress smooth and continuous.
Chart 4: Velocity
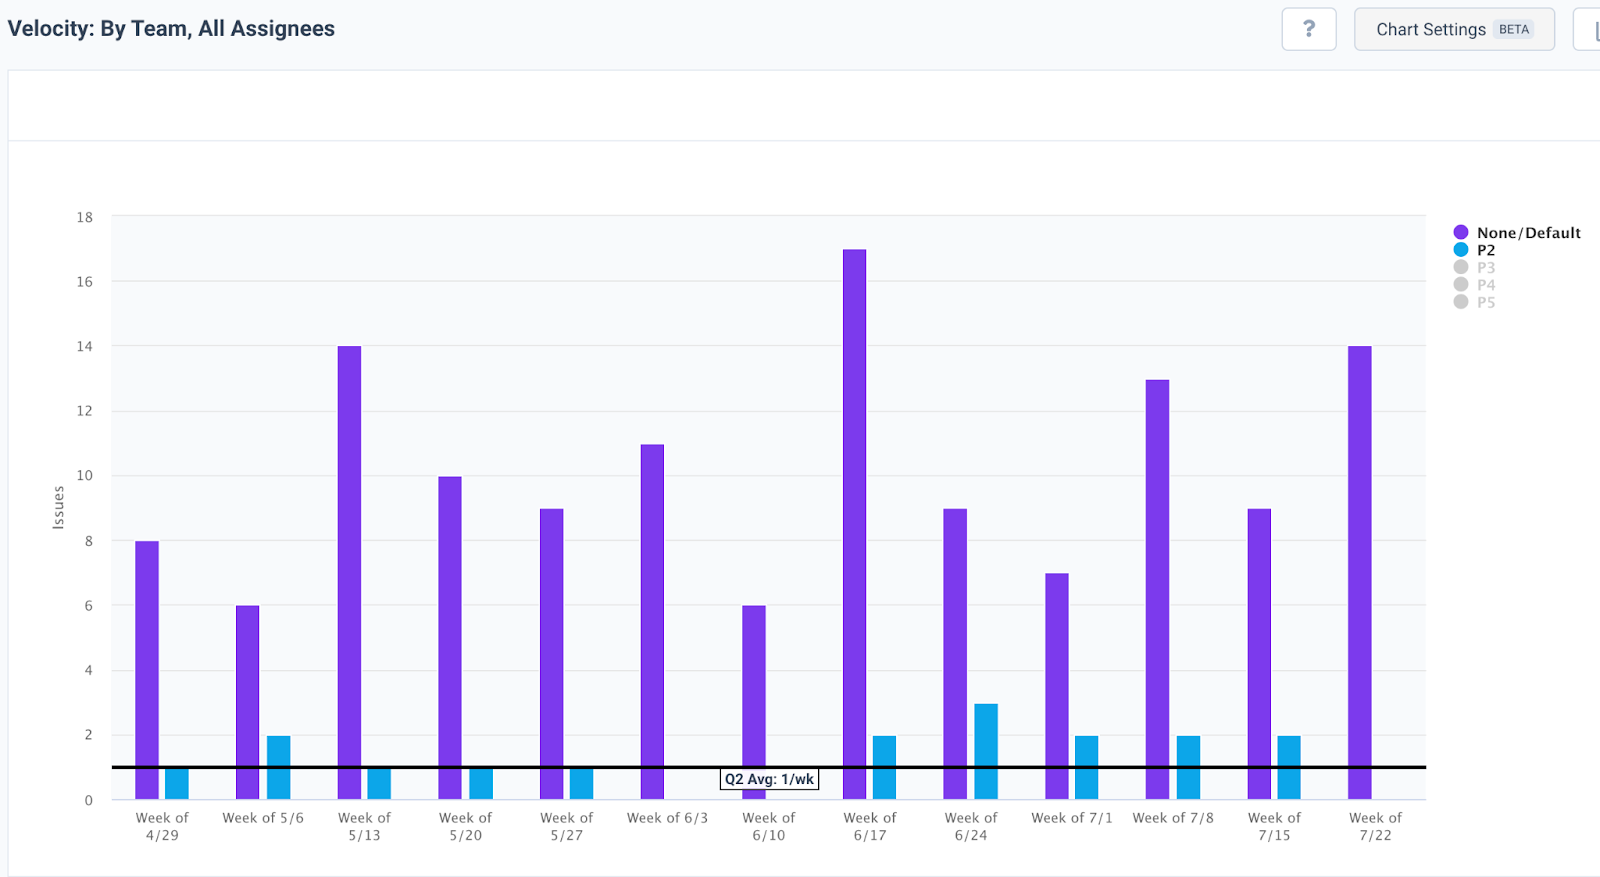
This is both total velocity as well as Change Failure. Combining the 2, we get a view of both speed/time to market vs changes that failed requiring a repair (P2). The target bar of 1 has been slightly missed in the past 5 sprints - indicating a conversation is required on the balance of speed and quality
Now, let’s evolve by adding one more view - the developers day to day perspective and the importance of including them.
Understanding developer perspective is crucial because numbers alone can tell a misleading story. You might see great velocity metrics but miss that your team is burning out, or poor sprint numbers when a team is actually doing vital tech debt work. That's why combining traditional engineering metrics with direct developer feedback gives you the complete picture. It's about knowing not just what your teams are delivering, but how they're feeling while doing it. By gathering real feedback through platforms developers already use, like Slack, engineering leaders can spot issues early and understand the human side of their metrics – making it a vital part of any engineering metrics strategy.
Chart 5: Qualitative Metrics/Developer Experience
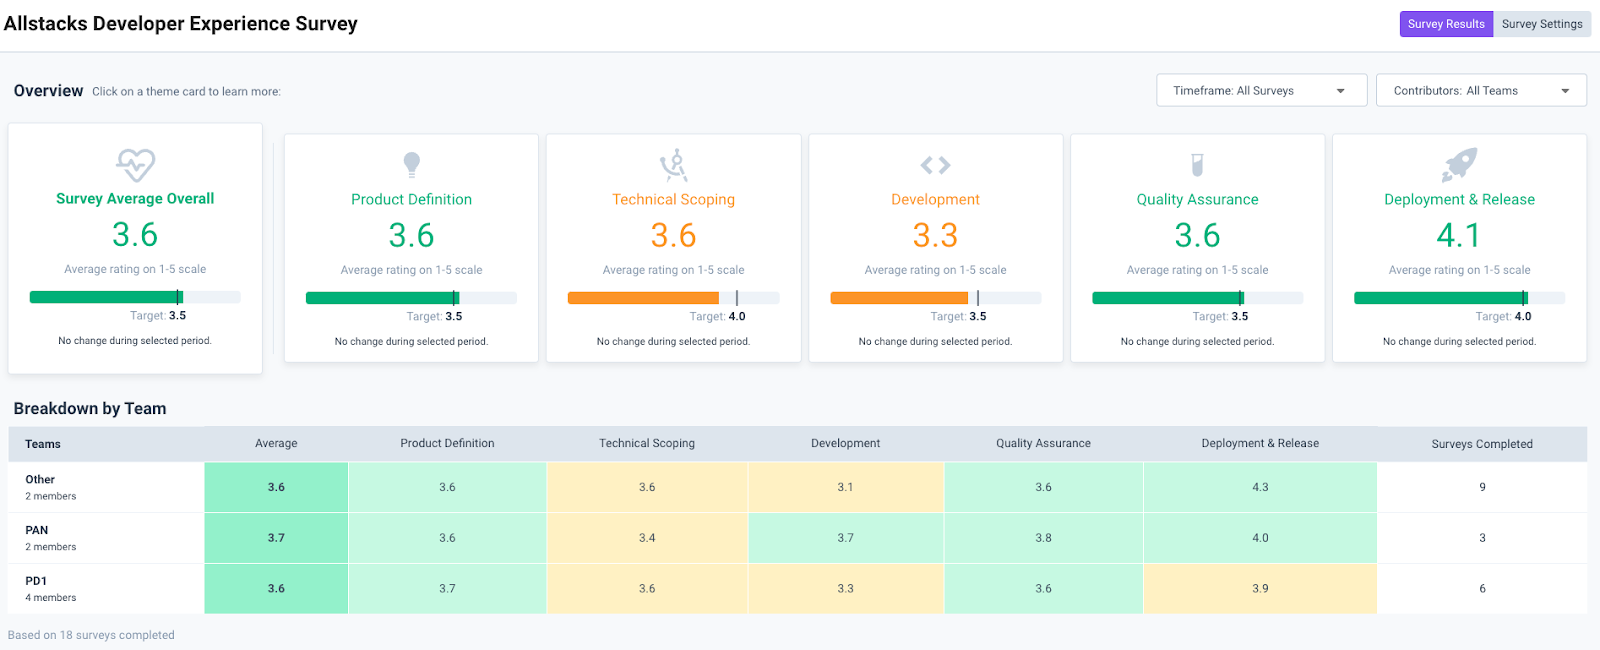
Here is a sample view of what some qualitative metrics collection can look like.
The above are a sample of metrics to get started with. Ultimately, you want to make sure you are measuring things that your customers would genuinely care about - speed and quality are often good candidates for this. In the longer term - comparing actual product usage against projected targets could represent a meaningful view and should be considered as metrics mature. Furthermore, including the opinions of your engineers can shed additional light regarding the total situation. Perspectives include, are the tools appropriate for the situation, is the process supporting high quality work, is there anything in the environment optimizing velocity, and others?
The metrics you choose to measure and manage should be intentional and adapt as your priorities shift. There is no one-size-fits-all. An efficiency play might call for measuring cycle time, while a new product launch may prioritize user adoption and engagement over engineering speed.
The key is to be deliberate about what you measure based on your current goals and priorities. Look to mature & master your use of metrics and the corresponding business goals you have. If it's not something you are actively monitoring and managing as a top line goal, there's no point measuring it. By defining clear metrics upfront, you'll ensure you can adequately manage what matters most.
Contact us today to discuss metrics, of all types, in greater detail!

like this? share it: