


Our perspective on an applied DORA strategy
This document describes the “Allstacks Way” of applying DORA. Organizations adopting DORA do so in order to understand how development teams are performing, identify where inefficiencies lie, and find ways to improve. The “Allstacks Way” addresses this problem at your organization holistically, rather than relying on one prescriptive approach. After all, organizations and teams aren’t all equal in terms of size, complexity, or how they quantify and qualify success. DORA provides a great baseline that we’ve been able to make our own here at Allstacks. For each of the four DORA metrics discussed below, we provide a typical example of that metric in Allstacks, however, the metric that’s ideal for you might take different forms.
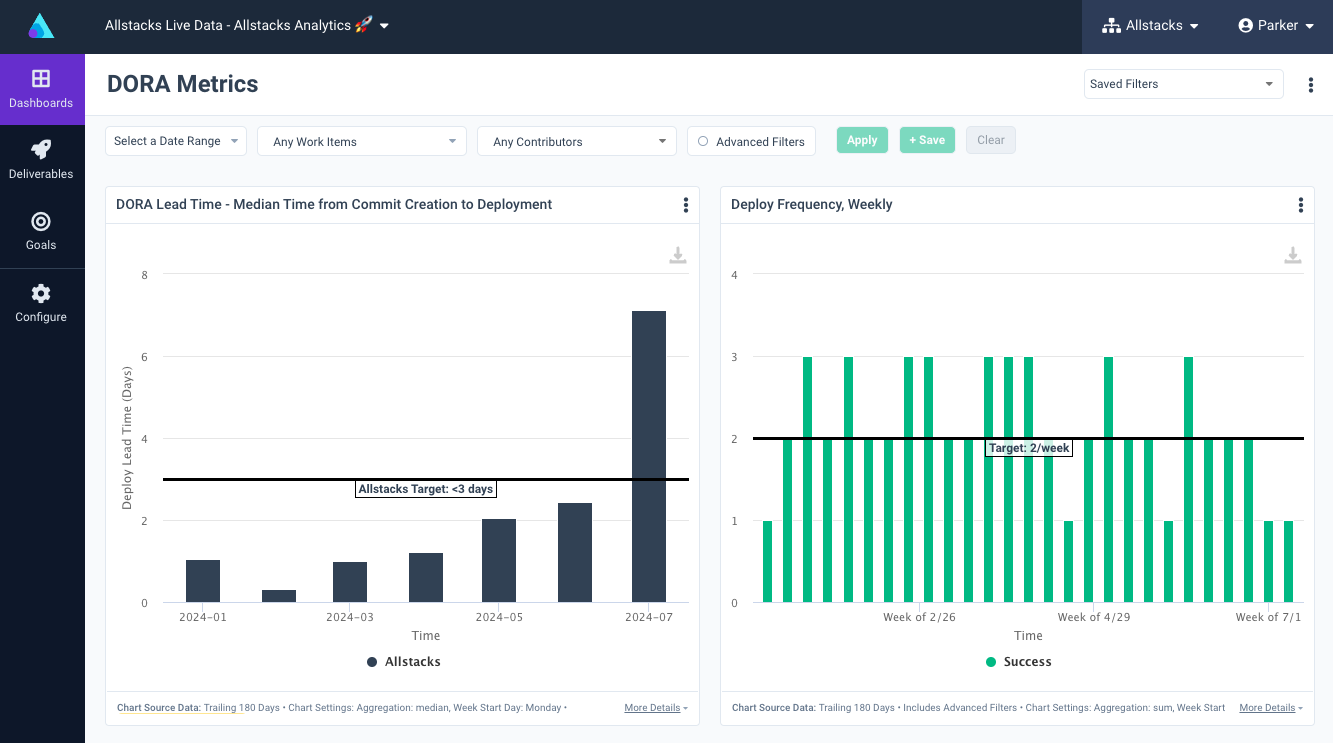
1. Deploy Frequency: The Production Environment is Just Part of the Story
The textbook DORA approach emphasizes increasing deployment frequency as a means of improving software delivery performance. However, an applied approach may also include monitoring deployments to the staging environment. For larger enterprises, where deployments to production may be less frequent, this practical approach will enable pursuing reduced size deployments - which may be displayed more readily in lower, non-production environments. Having both measures can demonstrate the primary goal of this measure which is higher velocity of small deployments.
Set up Deploy Frequency in Allstacks
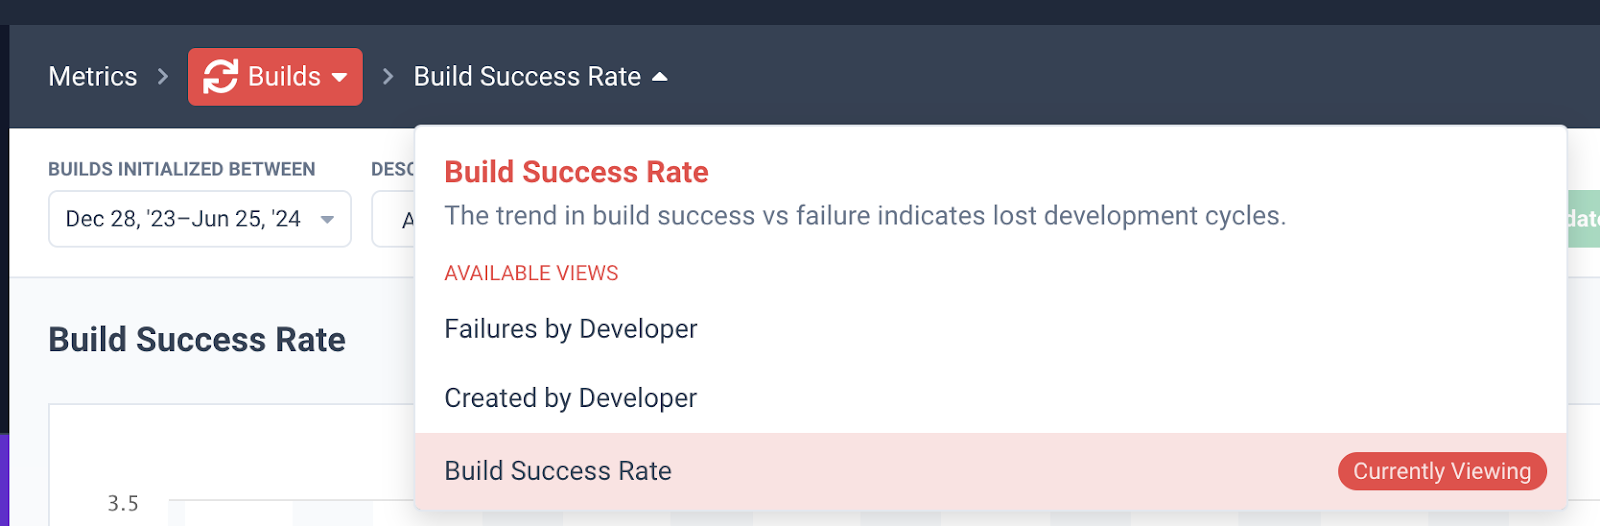
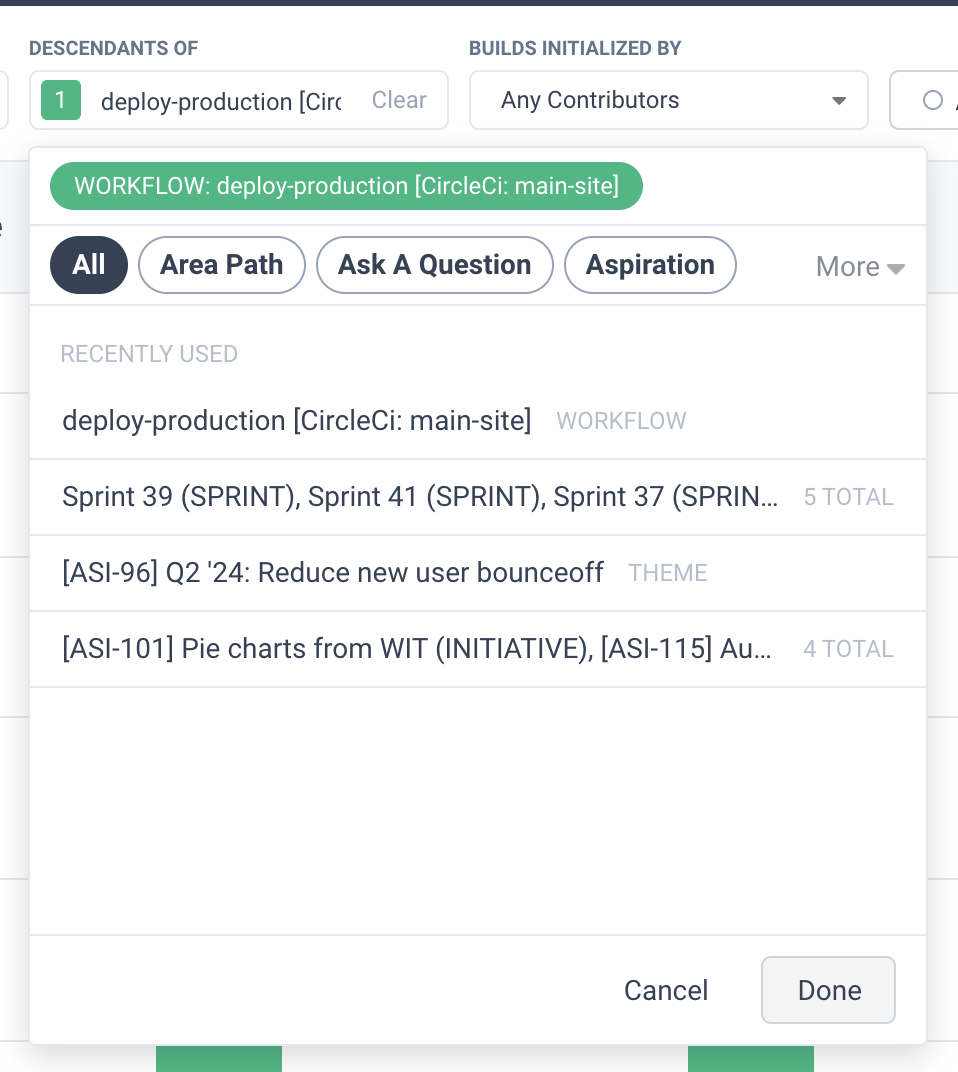
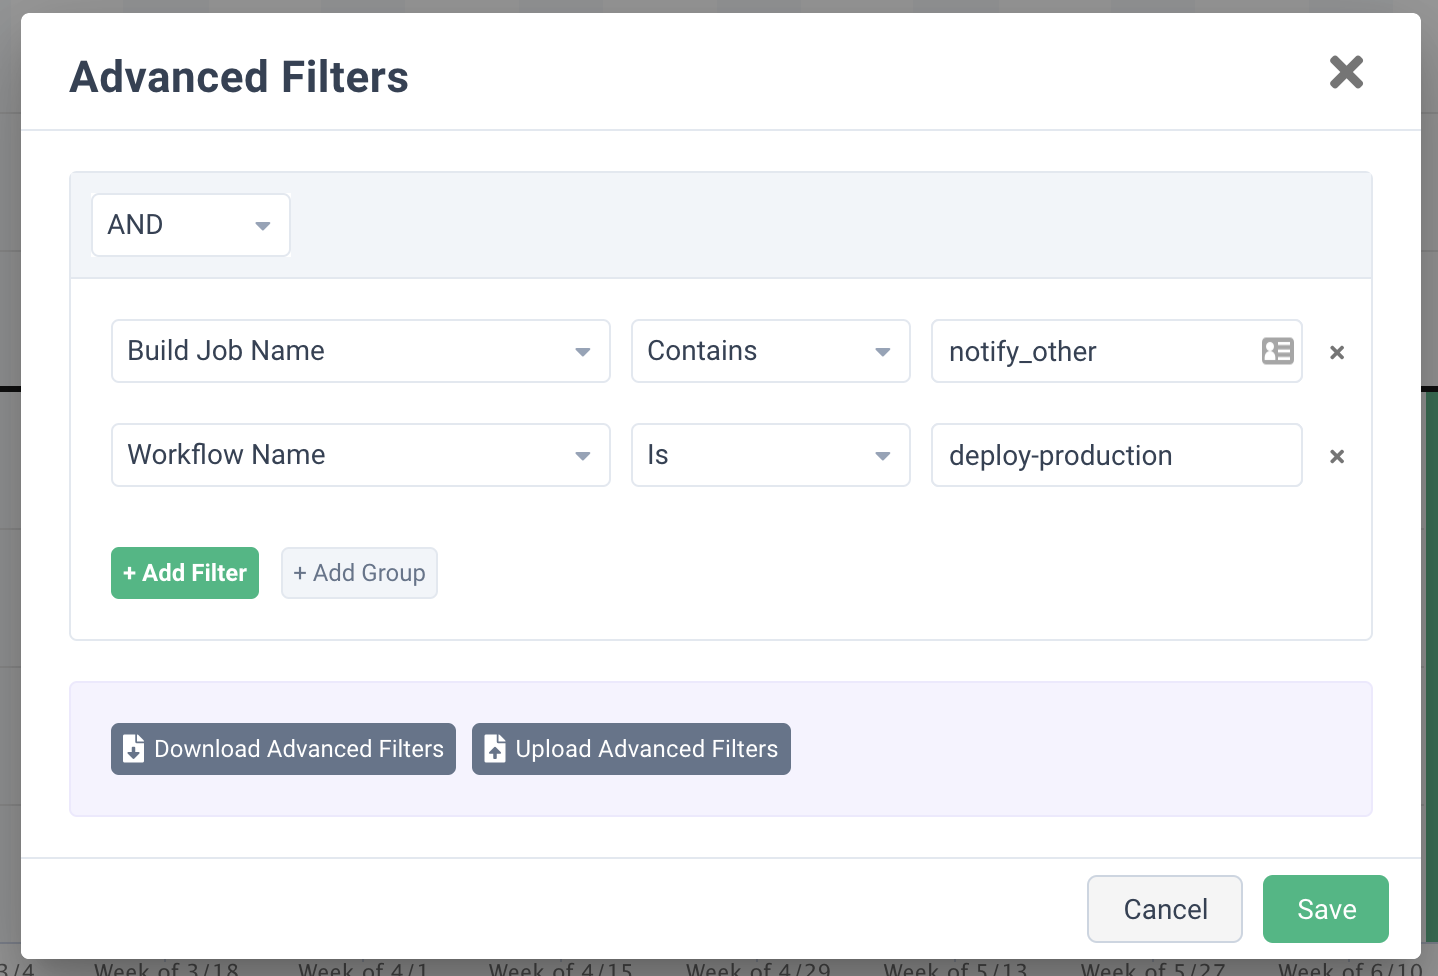
To measure Deployment Frequency, use the Builds > Build Success Rate metric in Allstacks. In the Build Success Rate metric, the ‘Descendants Of’ picker at the top of the page can be used to select a specific workflow that contains your deployments to production (or other environments of interest). You may need to use the Advanced Filters option to input specific strings to match on in your job or workflow names. If you’re interested in tracking deploys to production and deploys to staging, you can configure two Build Success Rate metrics for your dashboard, one for production and one for your other environments, and show them side by side. Here’s a step by step example:
Go to Build Success Rate
Enter your filters:
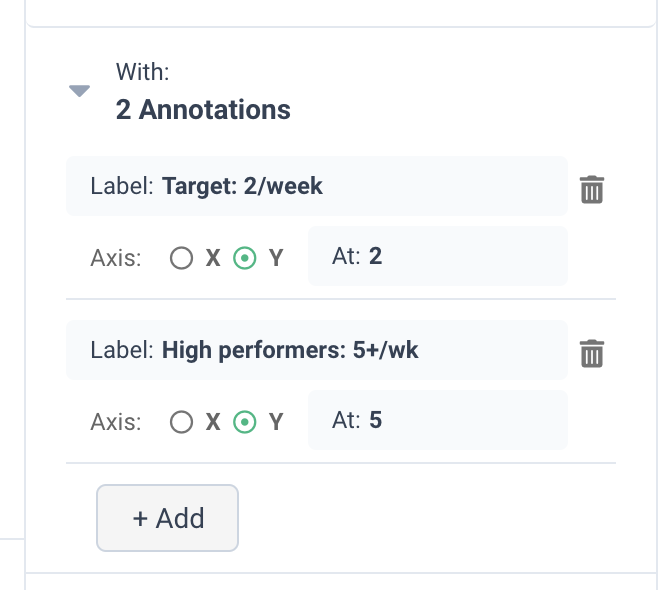
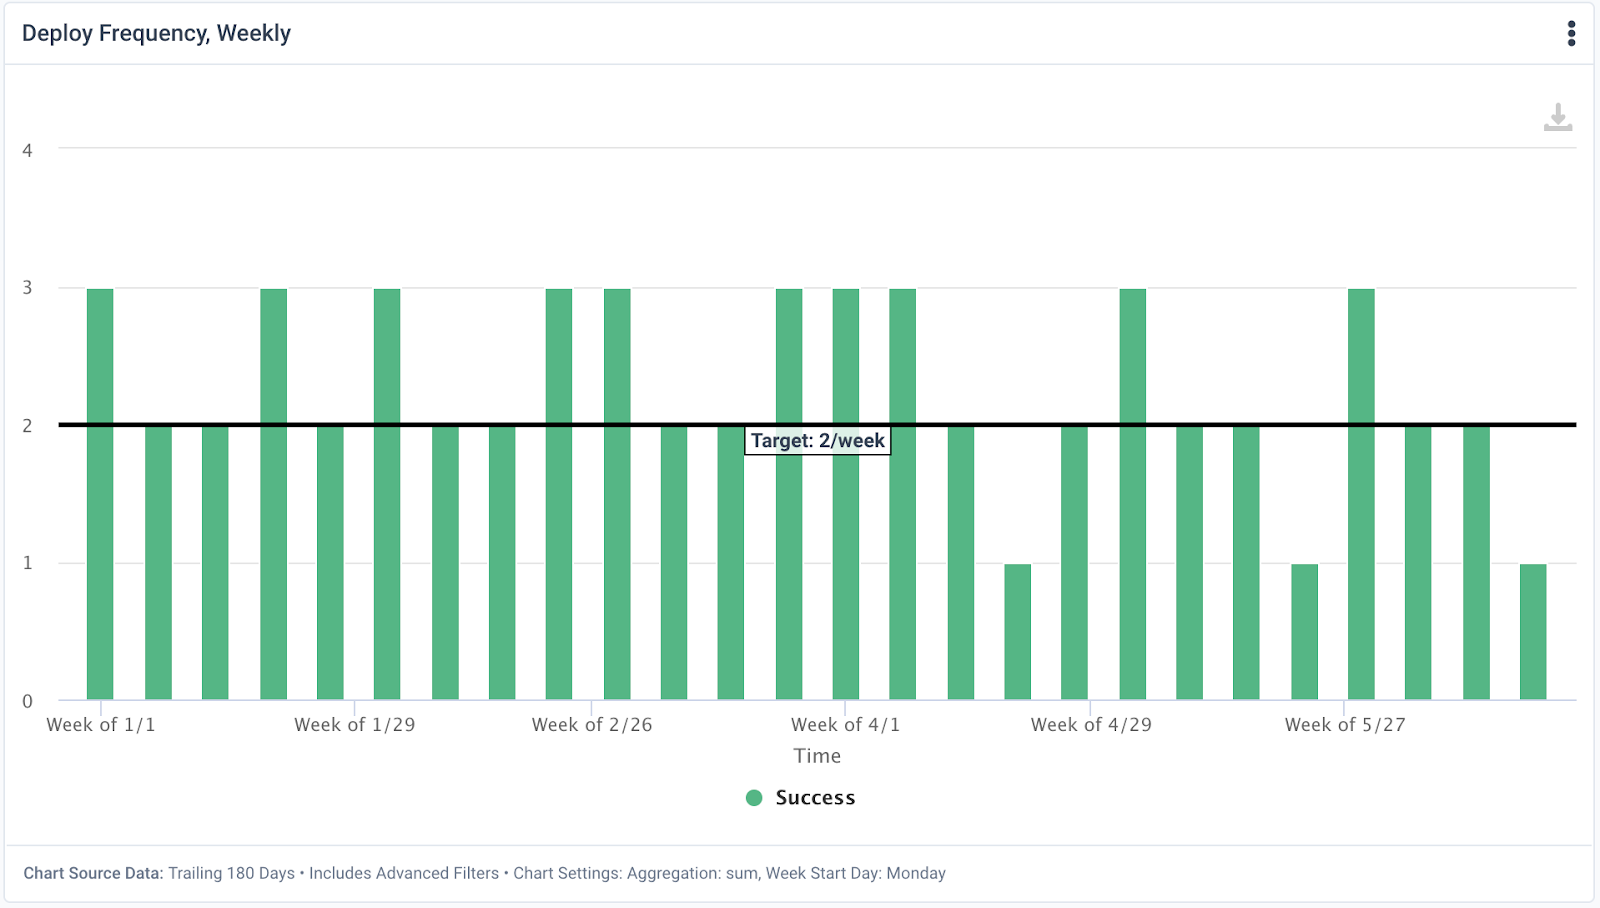
In Chart Settings, add annotations that indicate your benchmark or goal:
Add the metric to your DORA dashboard:
2. Change Failure Rate: Failures by Severity are More Useful Than a Rate
The Change Failure Rate metric, as defined by DORA, is a useful indicator of the stability percentage of the software delivery process. However, we recommend organizations may find more value in tracking specific failures, defects, or bugs that impact customers or business operations because these failures are more directly actionable, as well as repairable.
Set Up Change Failure Rate in Allstacks
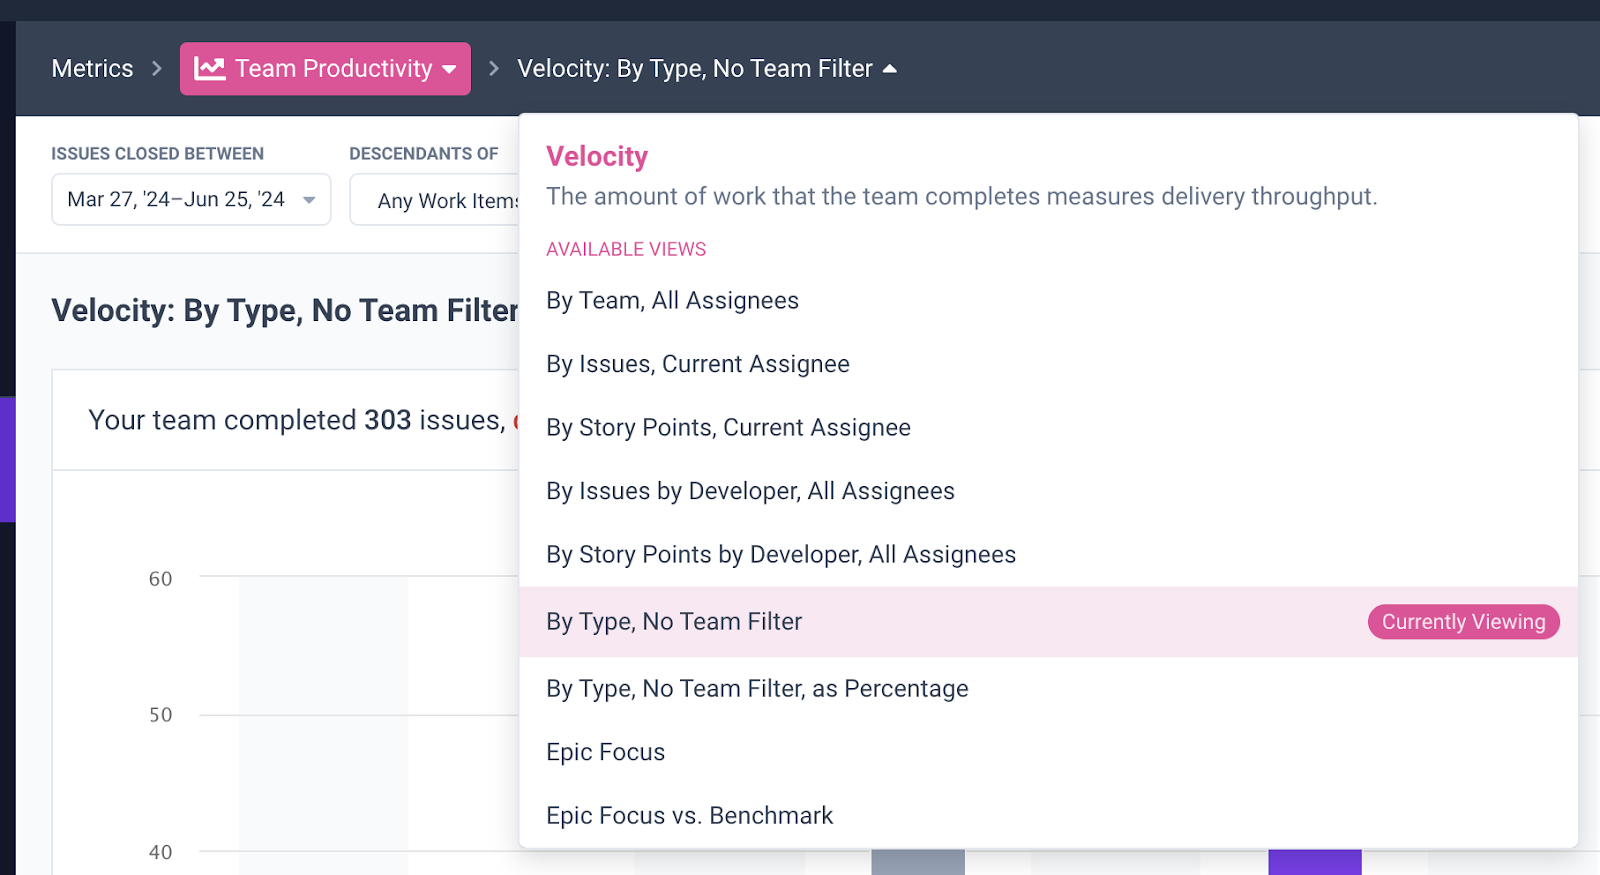
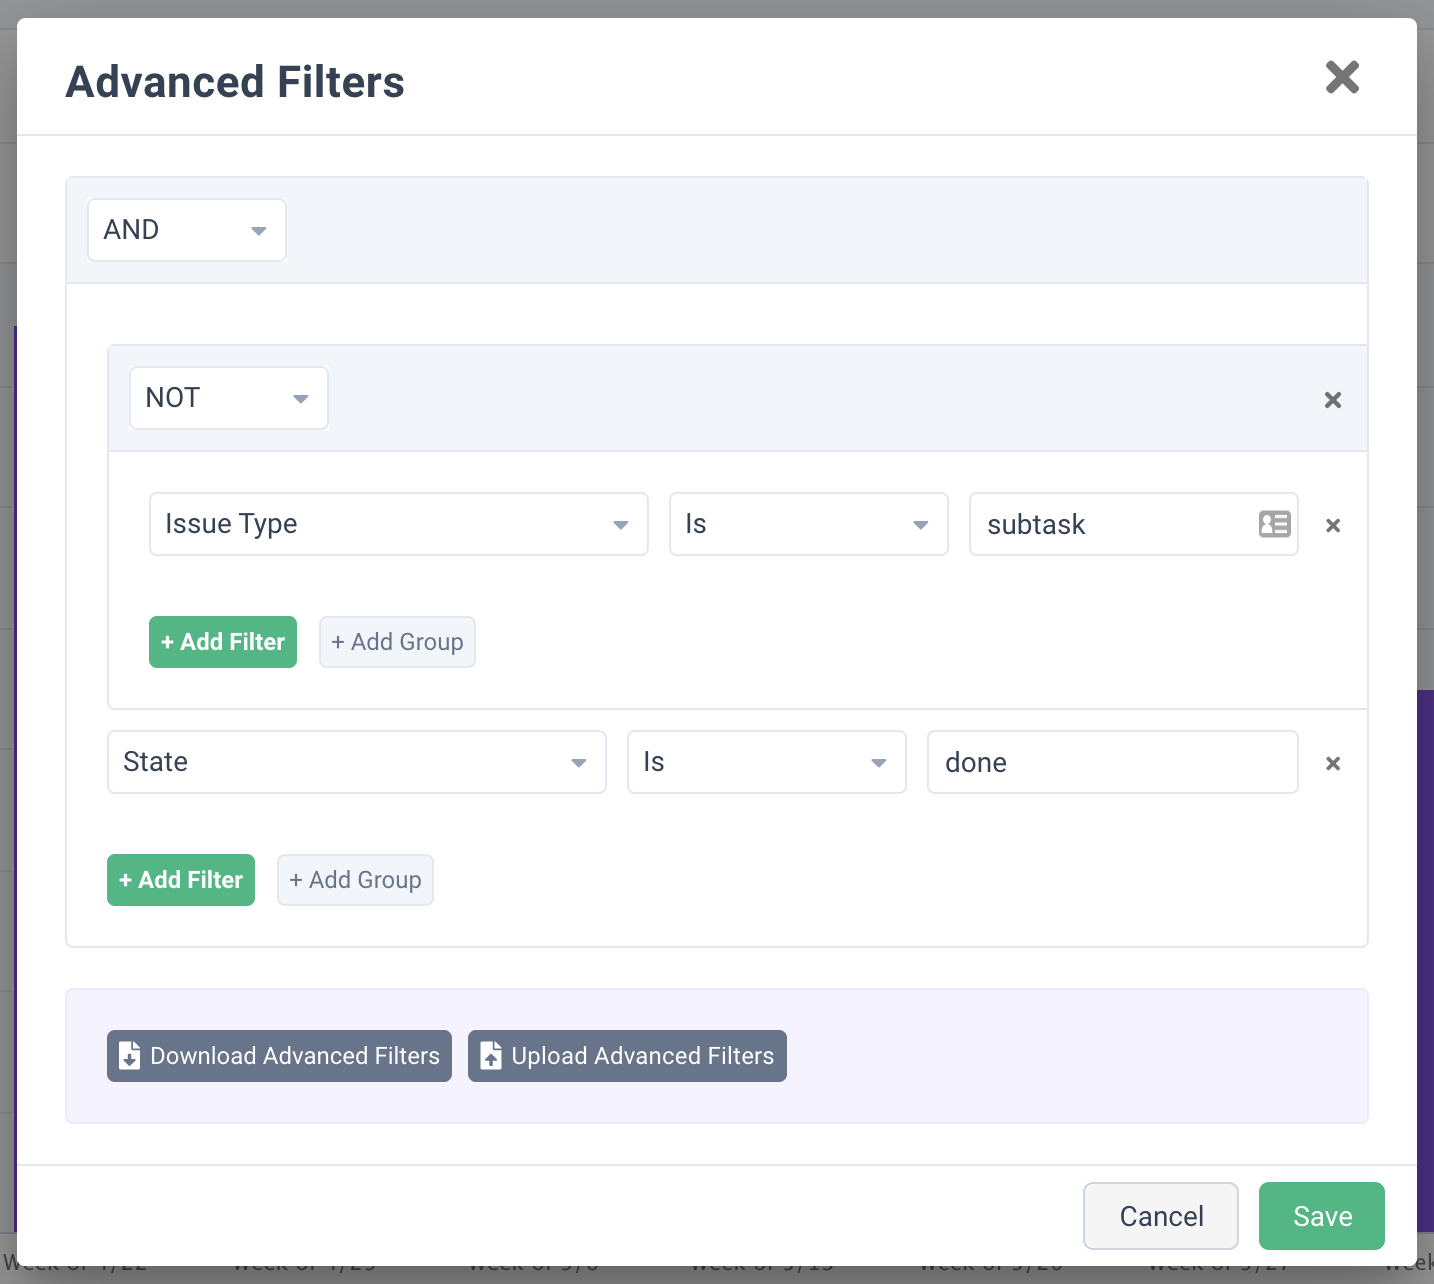
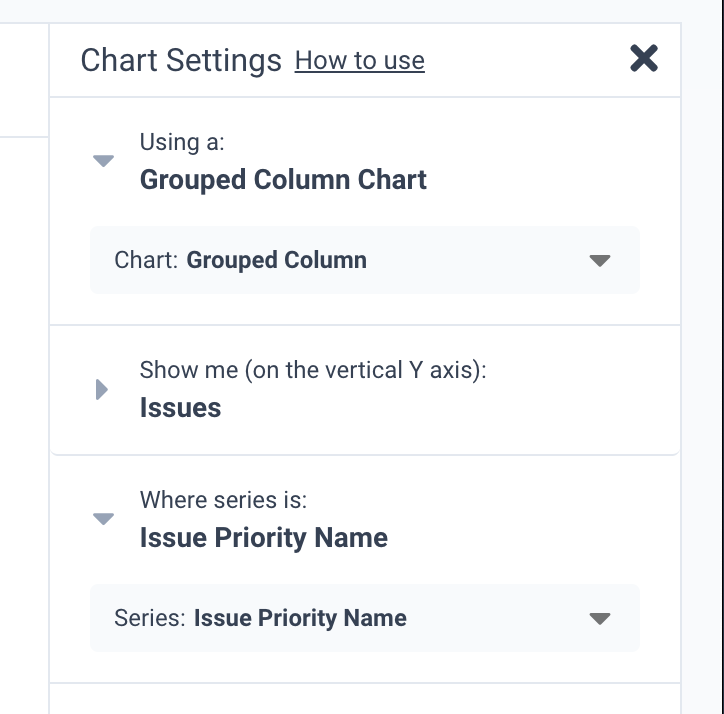
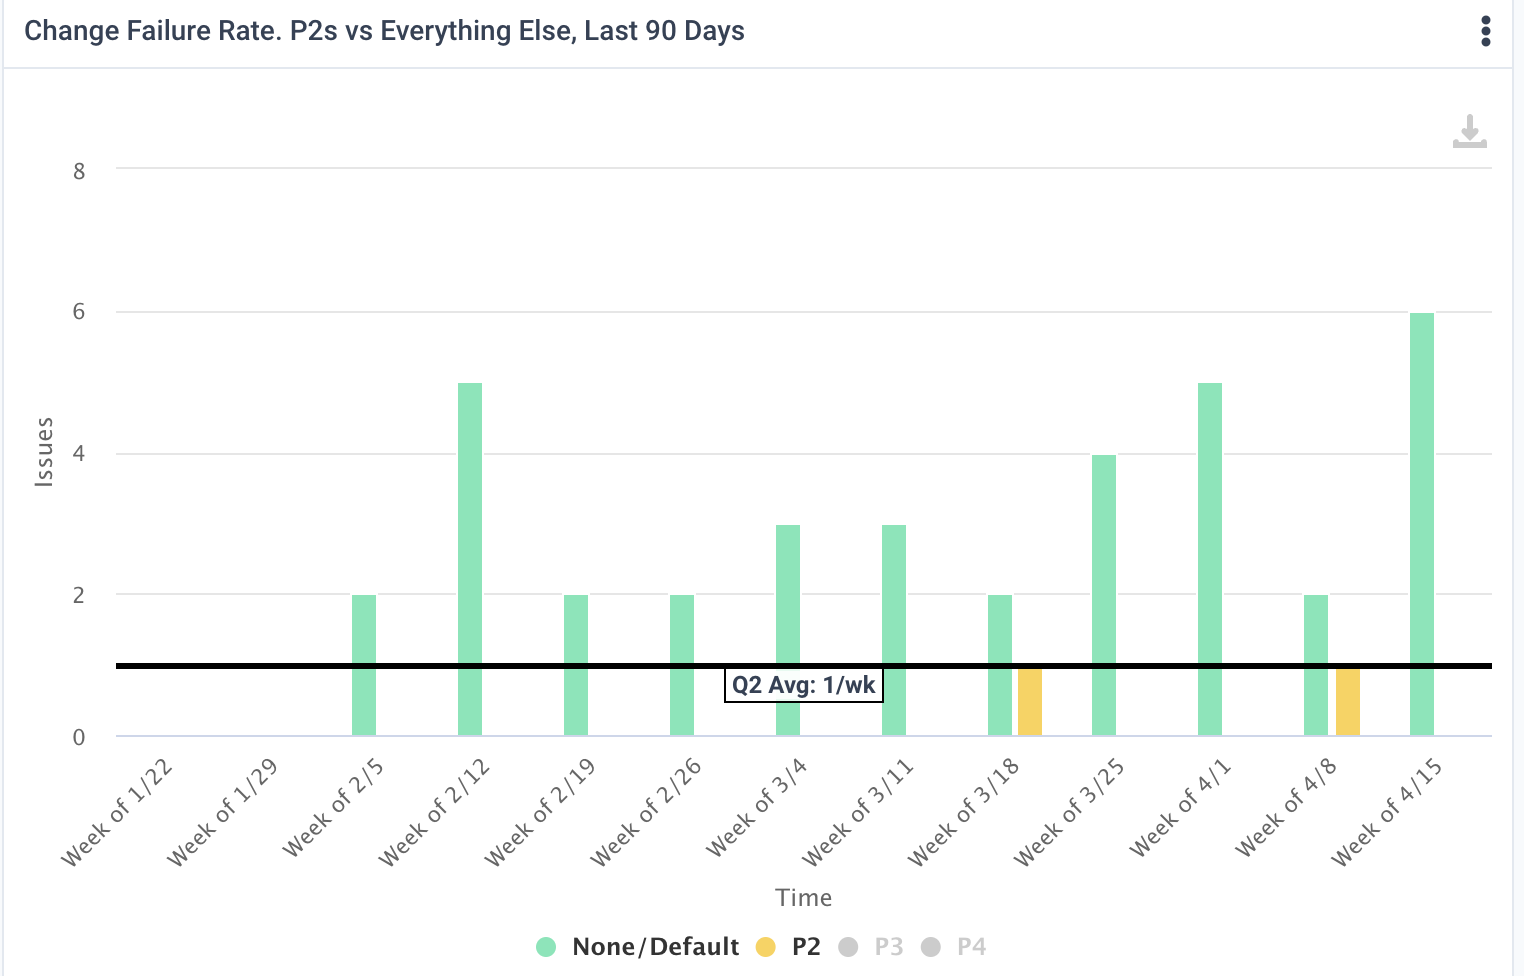
There are several ways to set this up but the most straightforward is to configure a velocity metric that compares the number of incidents dealt with per week versus the number of normal items completed. Go to Team Productivity > Velocity > By Type, No Team Filter. Use the Advanced Filters dialog to filter out statuses and item types that aren’t relevant. These are often “won’t do” statuses and card types such as “subtasks” or types that represent non-code work. Use Chart Settings to select a Grouped Column chart so that the volumes of different types of items per week can be compared. For your series option, select the field that indicates the severity of your incidents. We recommend you add annotations for your typical number of items released per week as well as a threshold under which the volume of escapes should stay.
Here’s a step by step example:
Go to Velocity
Enter your filters:
Configure your chart settings
Add your annotations and add the metric to your dashboard
3. Lead Time for Changes: Measure the Time the Business Cares About
While DORA provides guidelines for Lead Time for Changes, organizations should strike a balance between prescriptive targets and applied targets that consider their specific circumstances, such as the complexity of their software systems, the maturity of their processes, and the skill level of their teams. An overly ambitious prescriptive target may lead to rushed deployments and increased risks, while an overly relaxed target may hinder process improvement efforts.
Measuring the lead time from commit to deployed-to-production is an interesting and useful measure, but in our experience it’s a far less useful signal than the cycle time for an issue to travel from first-in-progress to done. A ticket can be in progress for days before the first commit is written. Commit-based lead time hides this behavior. Commit-based lead time doesn’t take into consideration that multiple commits are typically made over the course of a story. If a story is in progress for 2 weeks with commits being made every day, it’s not true that the lead time for that story was the average of the lead times of all the commits - aka 1 week. Instead, it was the whole 2 weeks the story was in progress. Therefore Allstacks recommends issue-based lead times as the more valuable signal for most organizations.
Set up Lead Time in Allstacks
Allstacks has a commit-to-deploy lead time metric that can be used to measure lead time in the classic DORA way. That metric requires some configuration by Allstacks staff. The process for setting up this metric involves meeting with an Allstacks engineer to review your organization’s deployment process and identify what filtering parameters allow us to get just your deploys to production, and from there calculate the lead time for all the commits in each deploy, averaging those lead times based on the time periods you select.
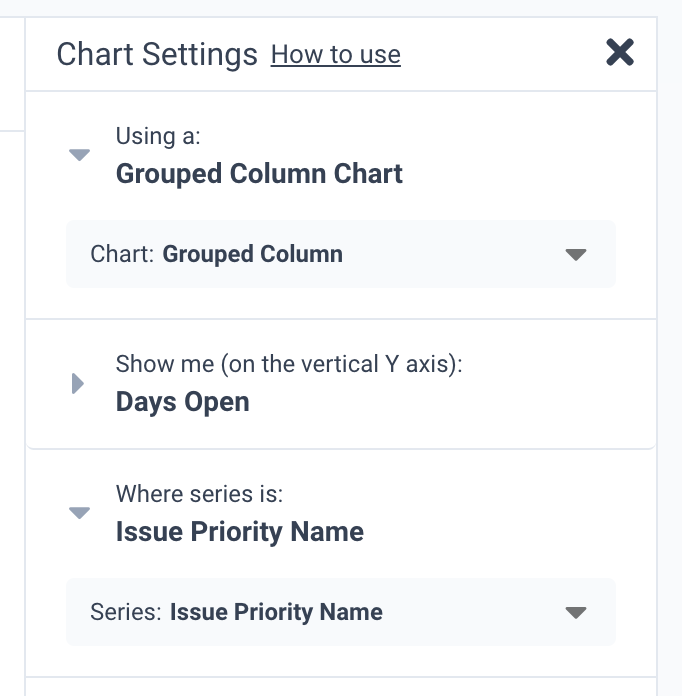
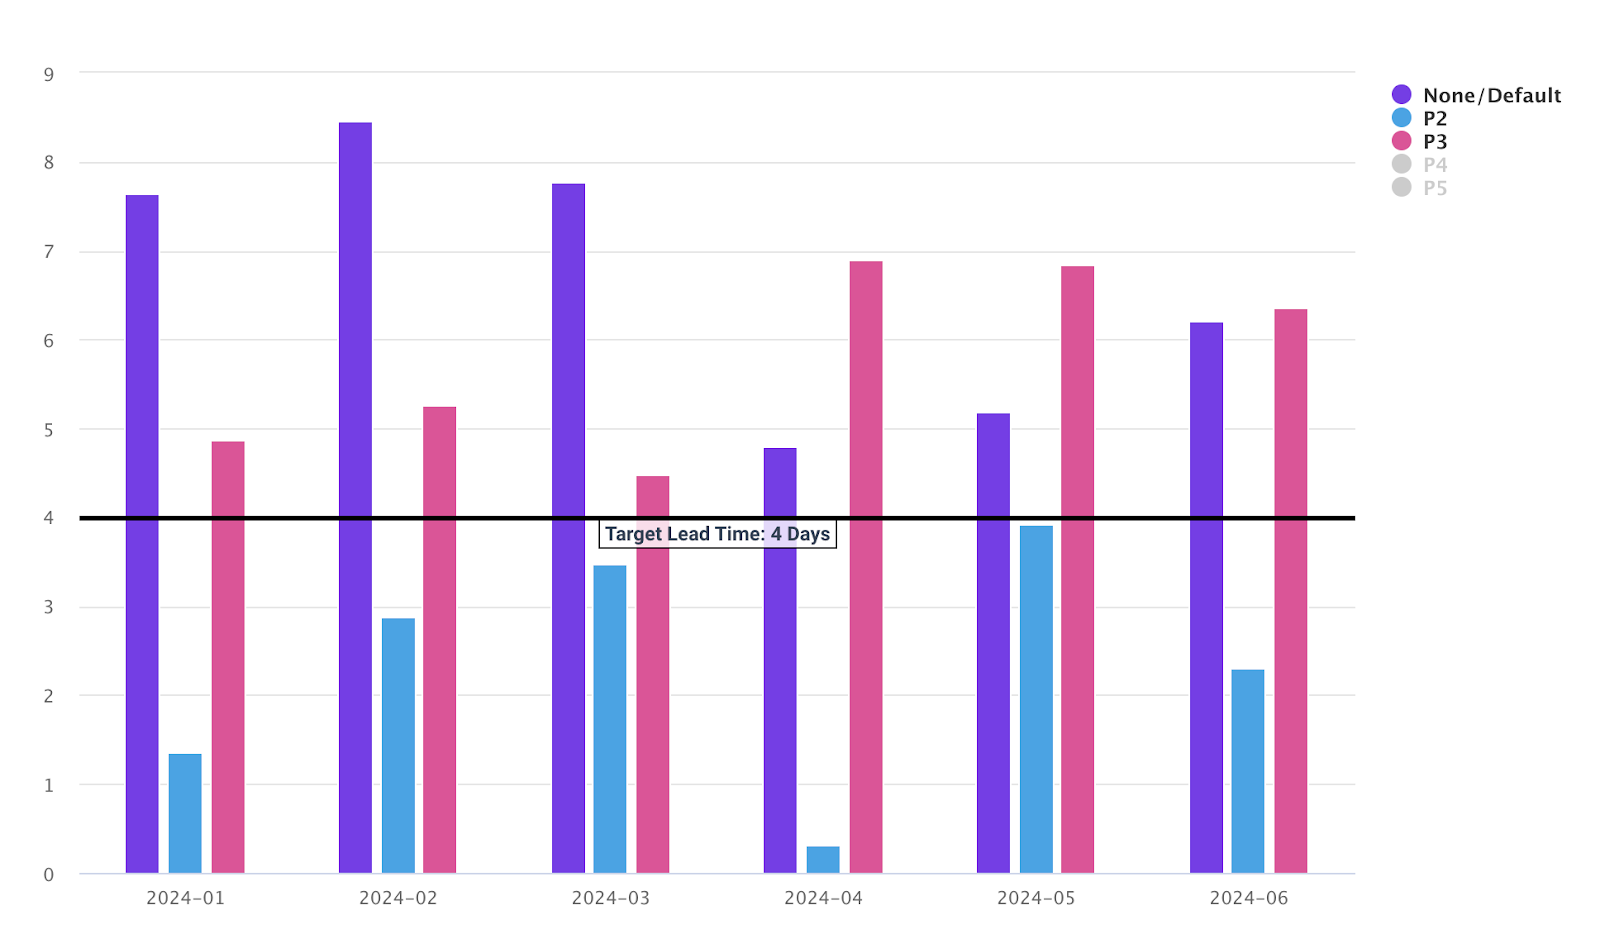
To create Change Lead Time based on tickets, go to Process Health > Cycle Time. The Cycle Time metric measures the time between first-in-progress to resolved, and ignores the time tickets spend in a backlog/to-do state. Use the Advanced Filters dialog to filter out statuses and item types that aren’t relevant. These are often “won’t do” statuses and card types such as “subtasks” or types that represent non-code work. You have several options for grouping the results so that the metric provides more insight. We recommend grouping by issue type so you can see how the lead time of bugs compares to the lead time of stories, etc.
Go to Cycle Time

Enter your filters
Optional: Group your data to distinguish cycle times of different types of work
Add annotations that represent benchmarks or targets and add to your DORA dashboard
4. Mean Time To Resolution: Include Remediation of Bugs and Associated SLAs
The Mean Time to Recovery (MTTR) metric is valuable for both prescriptive and applied approaches. In a prescriptive approach, MTTR can be used to measure the efficiency of a critical or severe incident response process. In an applied approach, MTTR can be tied to bug remediation and associated Service Level Agreements (SLAs), ensuring that critical issues impacting customers or business operations are addressed promptly and within agreed-upon timeframes.
Incidents can be remedied in a variety of ways. Some require code changes and a deploy, while others involve a non-code intervention - rolling back a deploy, toggling a feature flag, increasing a memory limit, etc. To track recovery time for incidents when several different kinds of recovery are possible, it’s important to have a system that tracks the human impact of incidents. This is typically done via a card type that represents bugs or incidents paired with a severity field. In this way, no matter how an incident is reported or remediated, the card can represent the journey.
Set up MTTR in Allstacks
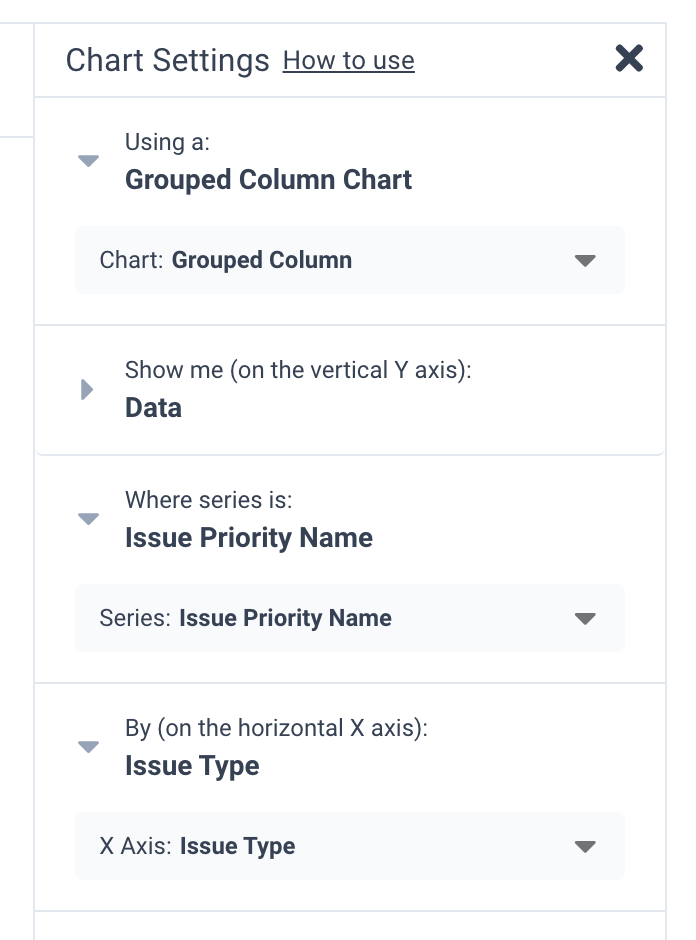
To create MTTR, go to Process Health > Cycle Time. Use the Advanced Filters dialog to filter for bugs and incidents at the severity levels that require a swift response. Group the results by severity in the Series options, and if applicable you can also group the data on the X axis by type to compare incidents of different kinds.
Go to Cycle Time
Enter your filters
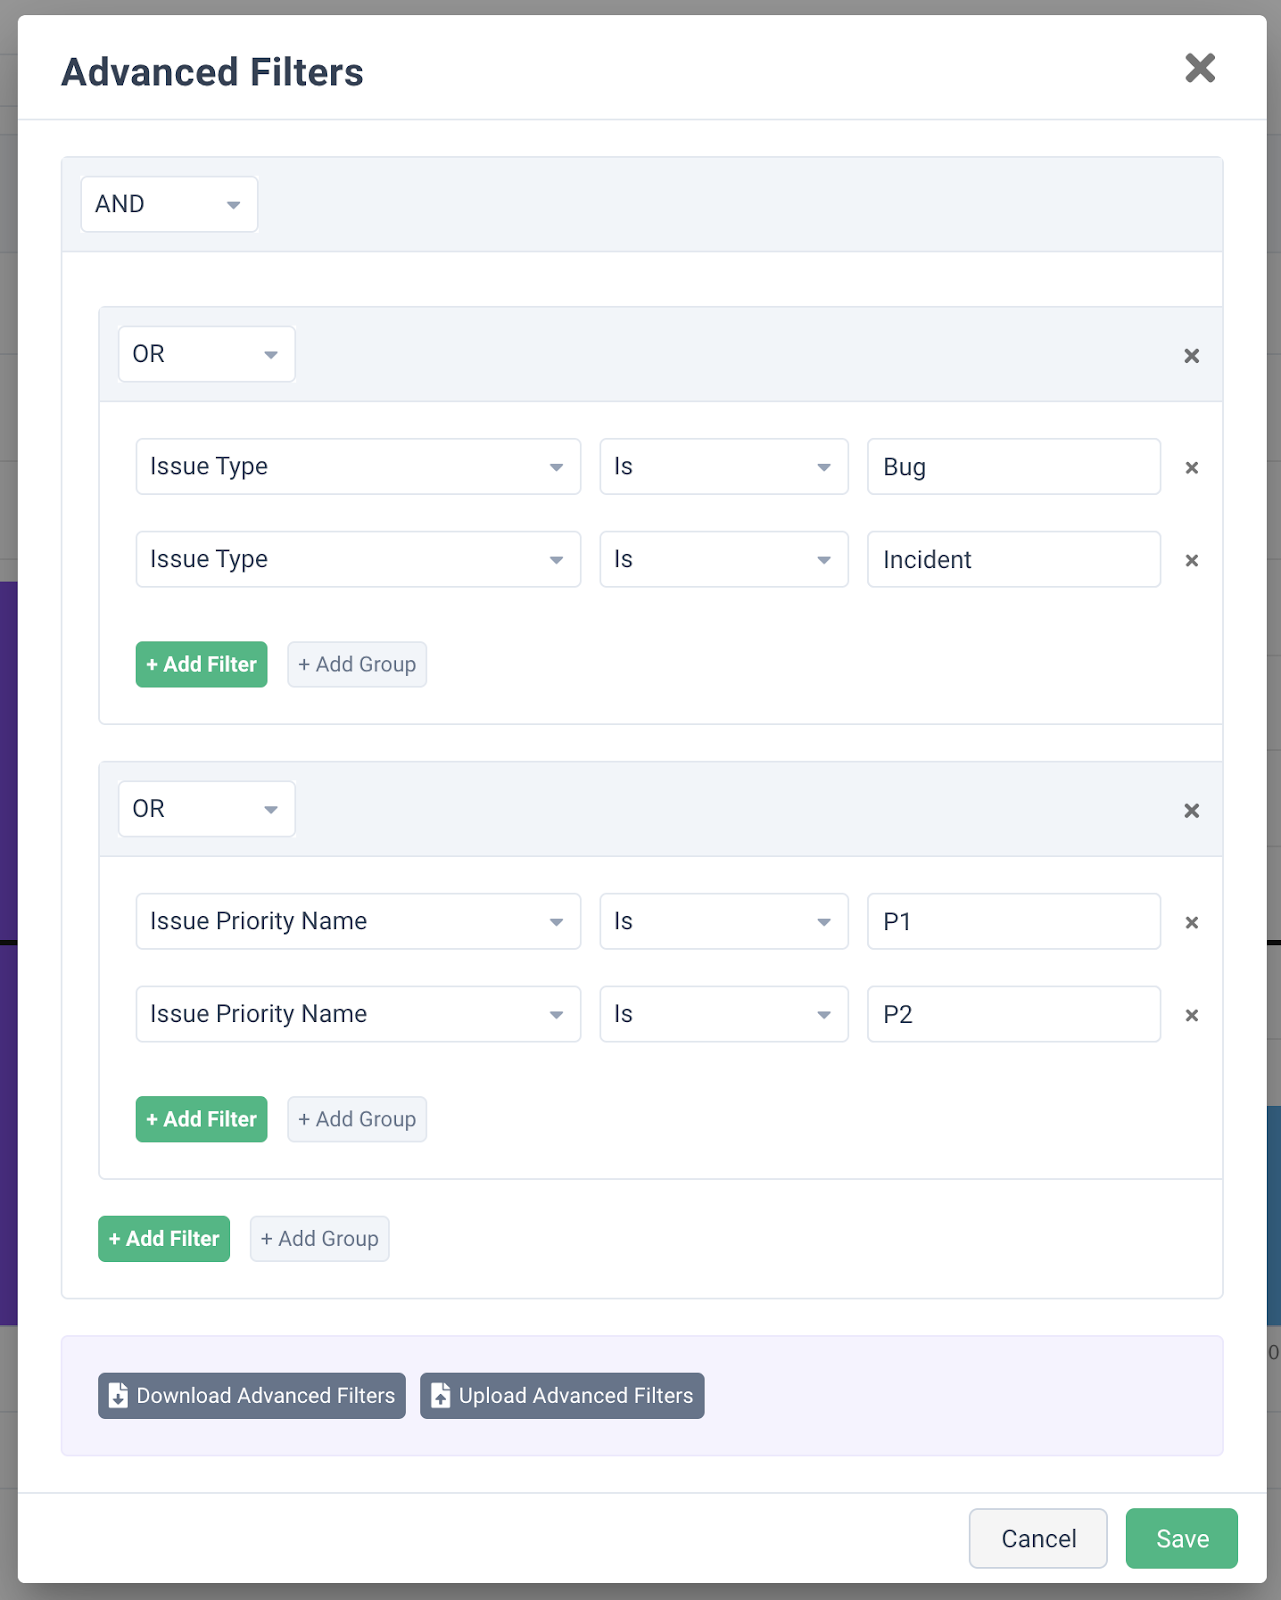
Group your data to distinguish cycle times by different severities
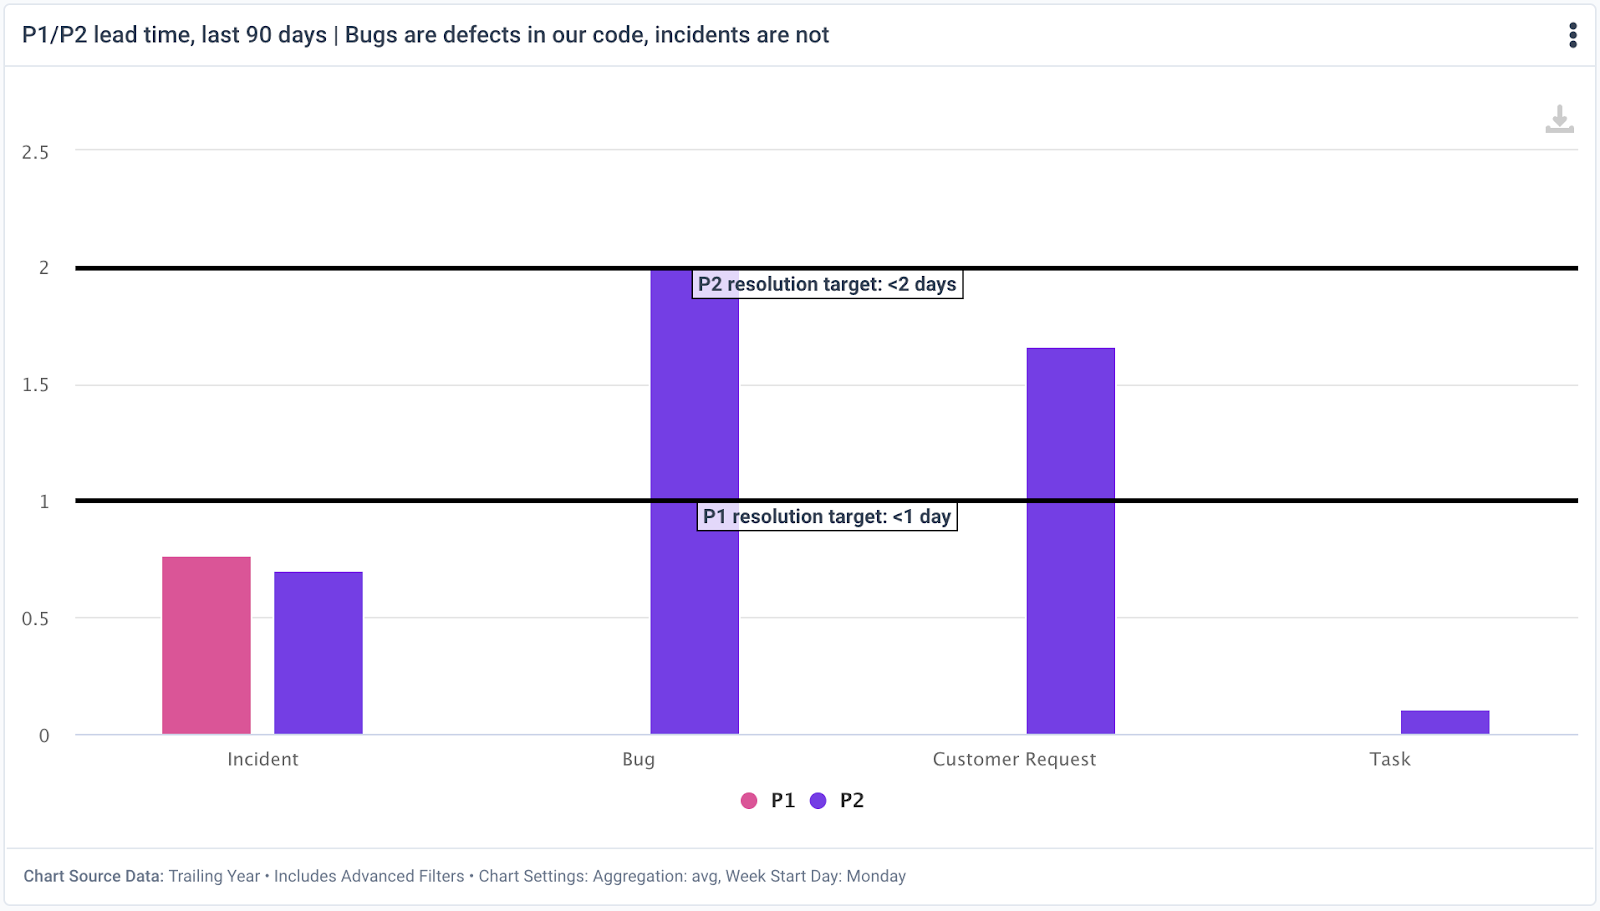
Add annotations that represent your SLAs and add to your DORA dashboard
Summary: DORA works best for an organization when it’s thoughtfully tailored to that organization’s needs.
While the prescriptive "as written" approach to DORA metrics provides a useful and valuable framework, an applied approach tailors metrics to organizational needs, focusing on value delivery, customer impact, realistic targets, and aligning metrics like MTTR with bug remediation and SLAs for optimal results. Organizations should consider an applied approach that aligns with their specific business objectives, operational realities, and customer needs for optimal results.

like this? share it: