Usually, I find out after a few complaints that “QA is holding up everything” or “Analytics is taking forever to get us the requirements.” It only comes to my attention after the delivery timeline is threatened and the pressure is on.
It takes skill to navigate those situations, and, of course, it’s likely to lead to a not-so-fun conversation with your boss about the timeline.
But, we can actually take some preventative measures by looking at trends in your data.
For the rest of this post, I will discuss some examples of management failures we’ve seen using actual data from the Allstacks development team’s process. We’ll take a look at understanding bottlenecks and issues using the data from our Active Issues metric, which shows the number of the problems you have in each development status for a project across all tools that are connected (i.e., Github, Jira, and Trello)
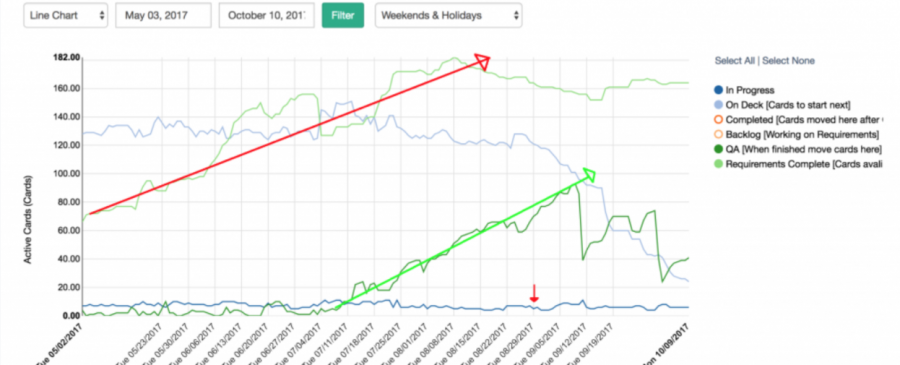
Let’s start with the dark blue line across the bottom of the graph.
Active Issues Metric
Let’s observe where the problems start: In the first image, we’re showing all of the intermediate steps (those between start and end) in our development workflow (we’ve simply hidden the rest.) I’ve highlighted two items, the red arrow and the green arrow, that are trending up. We can see here that issues are piling up in these two states: “Requirements Complete” and “QA.” That’s not good, a this is where the slowdowns begin.
Since this was our own team, we can share some extra insight into what was contributing to this scenario:
- At the beginning of the rise for the red arrow, we had just released the beta product. The majority of these newly created items were all of the bugs we found after putting our product into customers’ hands for the first time. Leave it to customers to find creative ways to break your software.
- Consequently, we had a lagging spike in our QA phase. Since our CTO (me) was solely responsible for QA at the time, this increase in bugs was quickly overwhelming. That, compounded with continuous context switching between customer success and development, led to a delay in shipping new features and bug fixes.

It’s essential to keep track of where the bottlenecks are in your team. They can come in many different forms and from many different sources. Still, one of the key early indicators of a bottleneck approaching are issues piling up in a particular state.
To learn more about how to get this data and automatically generate these insights, contact us to learn more about the Allstacks platform or email us at info@allstacks.com.
Written By:


