Our customers represent engineering and product leaders across many different industries and a common thread in all of them: they lack a simple way to see actual forecasted delivery dates for key roadmap items and projects. With this blindspot, leaders don’t know where their teams need support and can’t communicate effectively with fellow stakeholders to manage expectations and prioritize initiatives. The net result? Surprises, lack of trust, and missed deadlines.
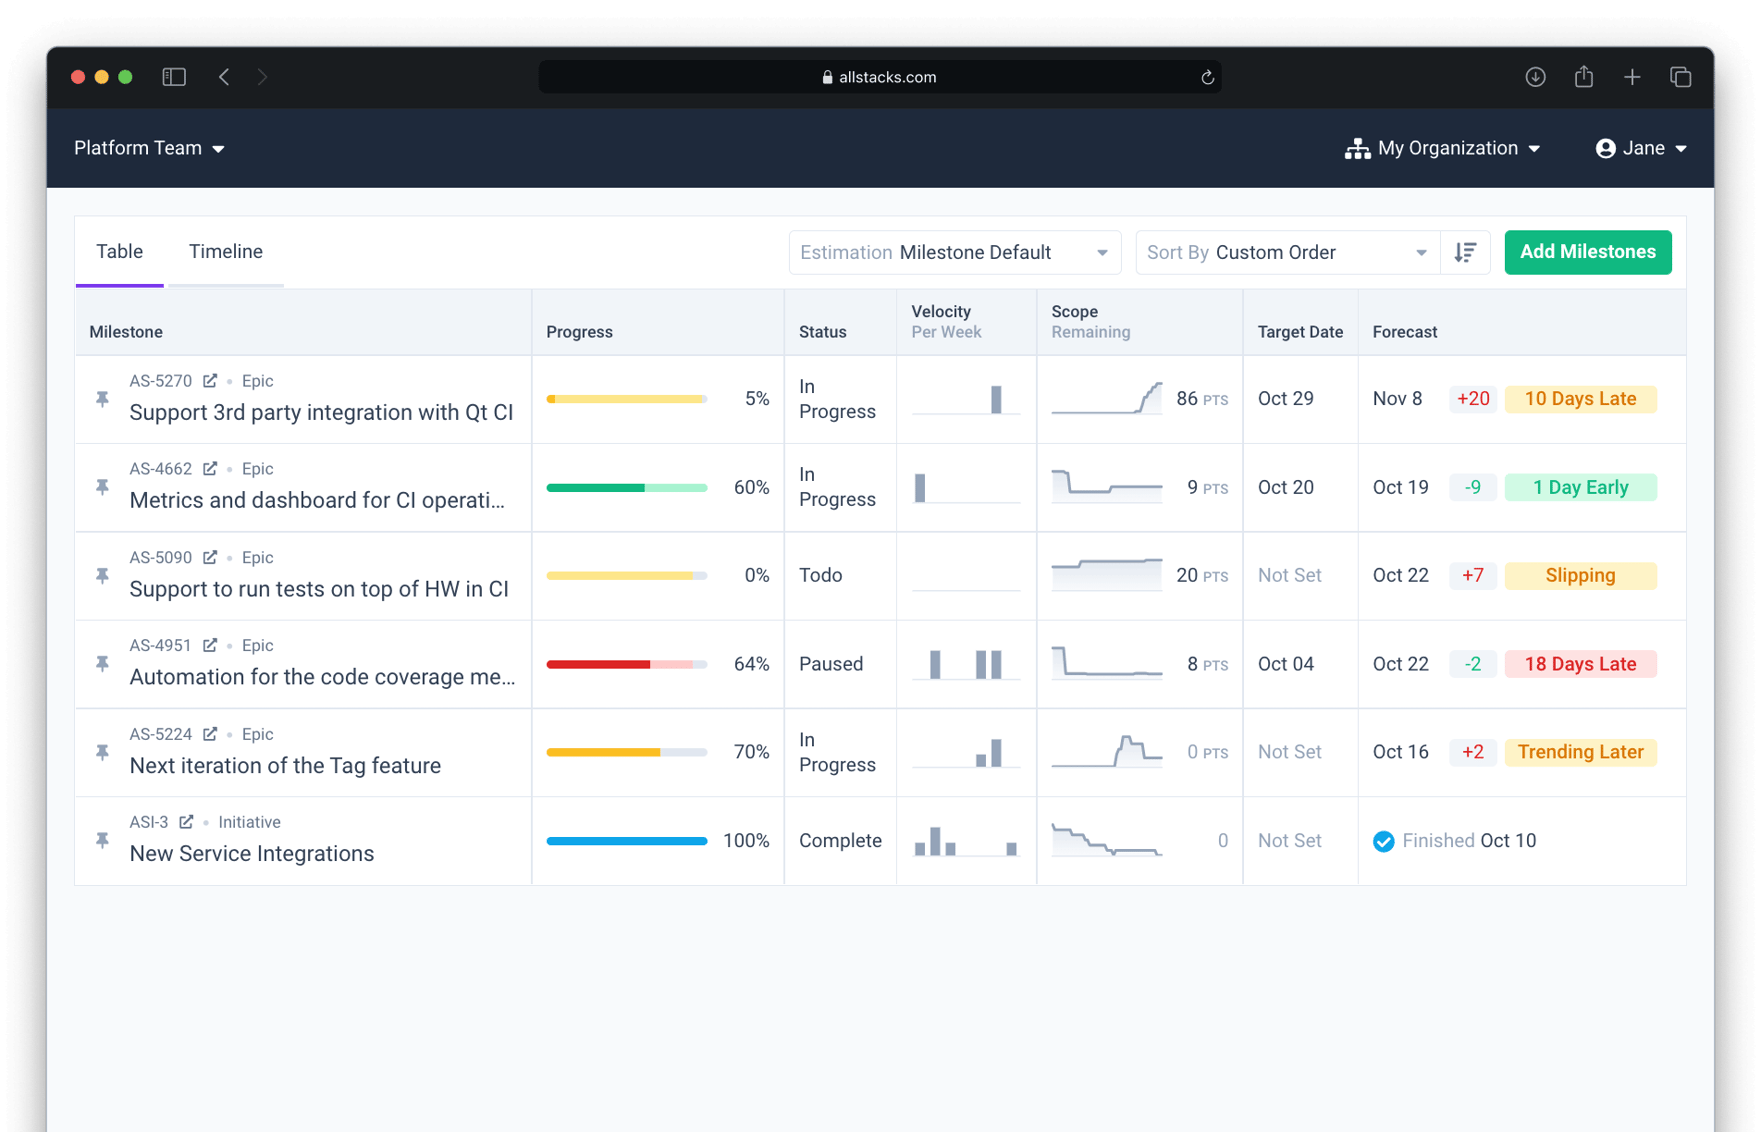
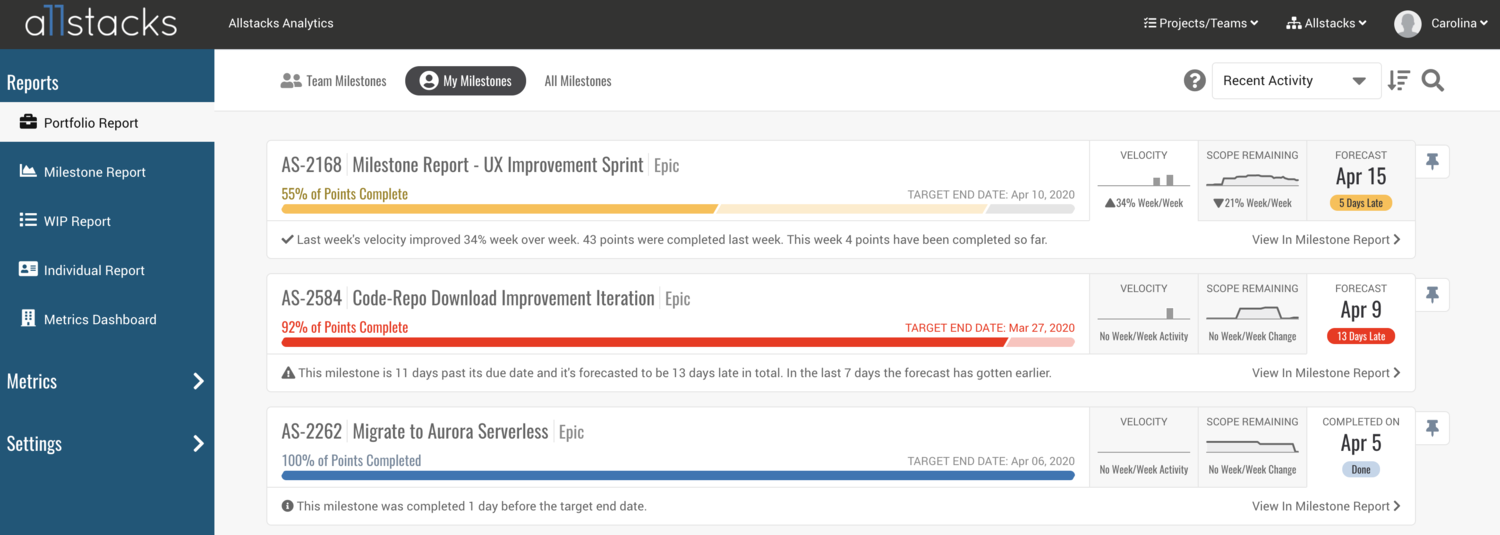
The Allstacks Portfolio Report is a summarized Milestone report that gives executives a high-level look across key roadmap items and teams so they can make informed, proactive decisions throughout the entire software development lifecycle. Each initiative or milestone is given a forecasted completion date that is driven by our predictive forecasting which is based on AI/ML models of historical trends of team activity. The Portfolio Report allows you to drill down into the risks across your entire organization before they become an issue.
- See what's on track, off track, and if you'll meet your target end dates
- Gain executive-level insight into the entire software org
- Can create custom views across teams or individuals
- Search for the initiatives you care about to check their status
- View velocity, scope remaining, or forecast to get more info
Why The Need?
Historically, teams have used manual processes to collect disparate data across tools to develop in-house methods for predicting when their software will ship and when they’re able to get their product or service in the hands of their customers. Many existing tools on the market don’t provide the executive-level information that’s necessary to make meaningful business decisions and communicate expectations to stakeholders. Maintaining multiple tools, aggregating data, and making sense of that info from various sources as your team evolves can quickly escalate; these cumbersome efforts cost you precious resources that should be focused on your core business functions.
The Portfolio Report centralizes all your software development data to not only help you align things that are in flight today but also help improve your software development efforts over time. We offer guidance on an ongoing basis to deliver actionable recommendations based on your unique data; step one is gathering the right data, and step two is knowing how to use that data to make incremental improvements in your daily operations.
-
Gain visibility: Quickly see what’s on track, what’s off track, and how progress is trending across all your development teams.
-
Proactively manage development risks: Uncover bottlenecks as they happen, and take action on potential risks to ensure you deliver projects on time.
-
Align expectations: Improved insights allow you to better communicate and align expectations with your stakeholders, customers, and internal teams.
How It Works
Allstacks integrates with the software development and project management tools your team is already using, like Bitbucket, GitHub, Jenkins, and Jira, so it’s easy to get started. Historical work data is sourced from your linked tools, processed daily, and analyzed by our proprietary algorithm to populate risks at the item level based on past work patterns. For example, risks may arise from the way employees are writing code, changing the project scope, or how your team’s velocity has suddenly changed. You can view work status, insights, and risks no matter what project type you’re using in your other systems (epics, sprints, etc.). Having a bird’s-eye view of how well company-wide initiatives are tracking against your goals is invaluable.

Take an interactive tour of the Portfolio Report here.
You can browse or search for the work that you care about the most, and pin it to the report. Use the dropdown to see different types of work such as epics, initiatives, and sprints; search by ticket name or ID; or, filter by recent activity to see what your team has recently worked on. Your pinned tasks will then display at the top of the page. The Portfolio Report offers a shared view for anyone you wish to invite to your dashboard, as well as an individual view.
You’ll notice that our progress bar shows work that’s been completed, work that’s been estimated but not completed, and work that’s unestimated. Allstacks automatically estimates the workload based on your past work patterns.
You can toggle across the forecast, burndown, and velocity tabs to get more information about each, like how your forecast has changed and why. If you want to drill down on a particular work item, you can simply click on it, and you’ll be taken to the Milestone Report, which gives you more on scope, contributor activity, velocity, and related alerts for risk management.
Get a tour of the Allstacks Portfolio Report and find out what we can uncover for your organization!
If you would like to learn more about the Portfolio Report and Allstacks’ holistic solutions, schedule a call with.

Written By:


