The agentic platform for product and software development
Purpose-built AI agents for product and development teams to plan, manage, measure, and optimize their software creation.

Trusted by
/ current painpoints /
The bottleneck moved upstream. Work definition is much more difficult.
You own where the product goes next, and development is moving faster than ever.
- Piecing together context scattered across disconnected tools
- Preserving intent as requirements move between teams and tools
- Keeping requirements, specs, and research from going stale
- Balancing priorities and feedback coming from every direction
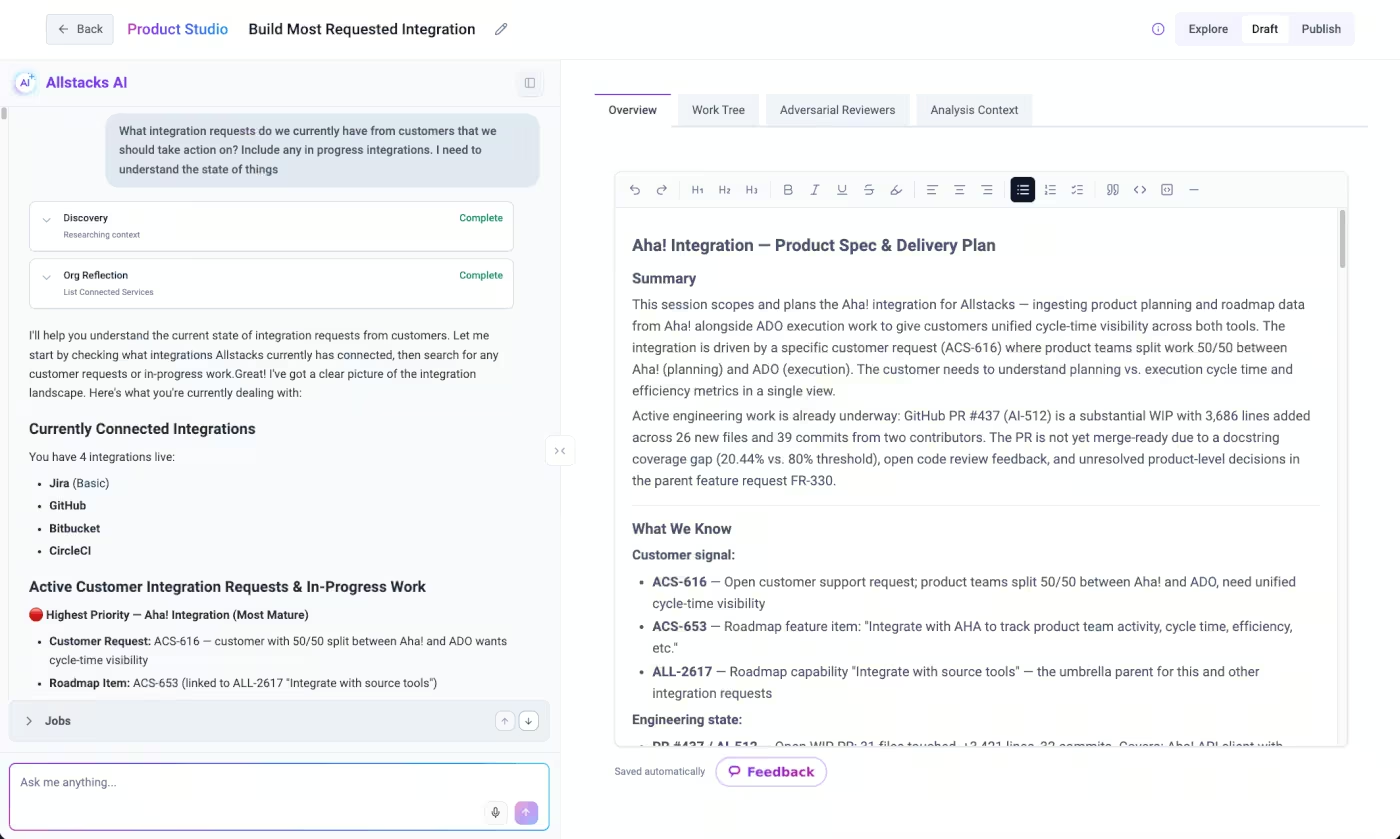
Define and refine in one place, grounded in technical reality.
A shared workspace to define and refine the work together, grounded in your code, customer voice, and delivery history.
- Ideate with full engineering context
- Define requirements against real constraints
- Pressure-test ideas and work with adversarial AI reviewers
- Score readiness before every handoff
- Export build-ready requirements and tickets that stay in sync
By the time the risk surfaces, the cheap fix is gone.
You own delivery, but you're running on scattered signals and lagging metrics while AI accelerates output faster than you can track it.
- Correlating Jira status, GitHub activity, and CI/CD numbers manually
- Blindsided when an on-track initiative gets delayed
- Guessing whether AI adds real velocity or hidden rework
- Briefing leadership on numbers you don’t fully trust
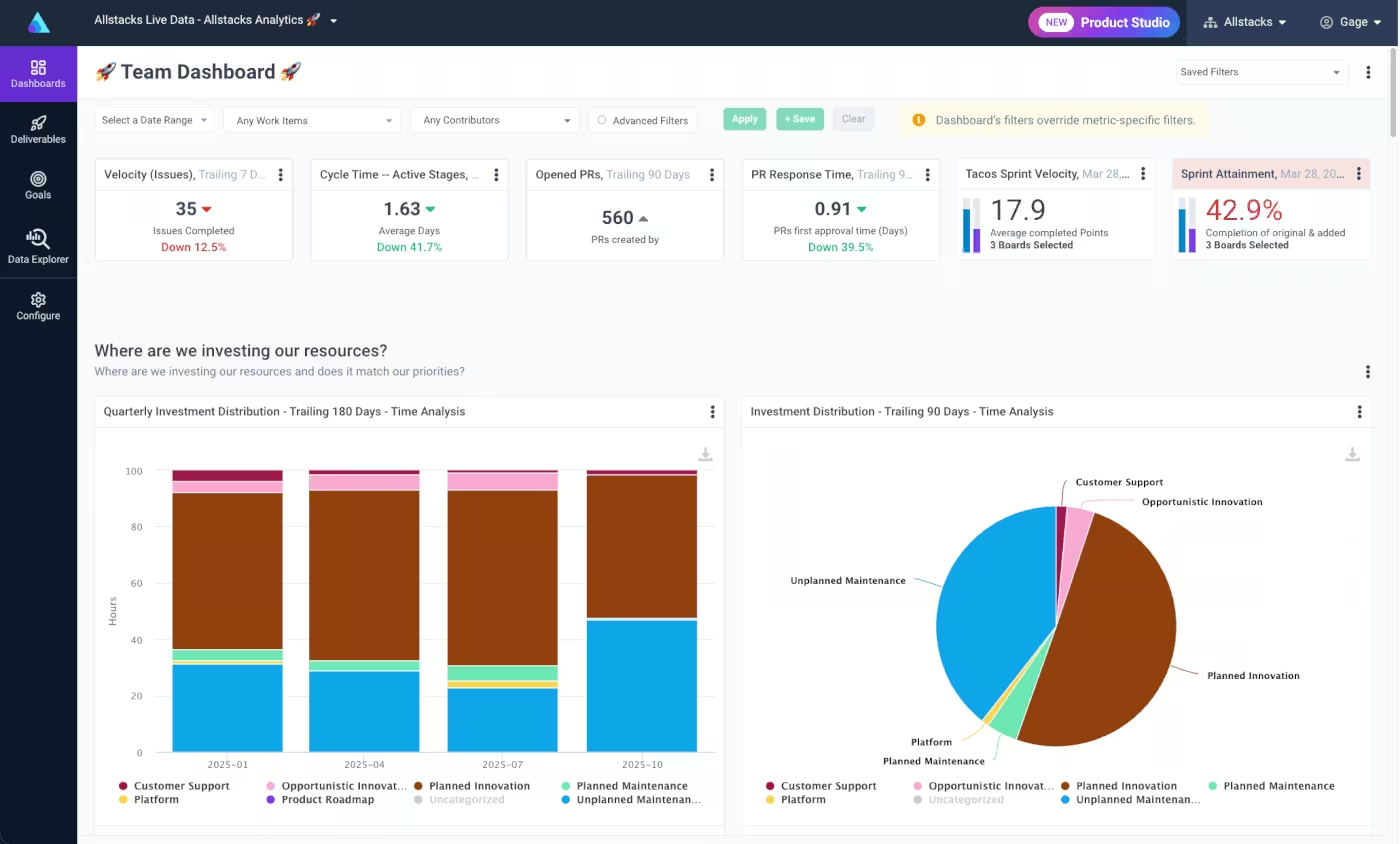
Turn scattered signals into answers before delays emerge.
Unified intelligence with always-on agents give you answers on delivery and impact before a delay becomes a crisis.
- Catch delivery risk weeks early
- Trace a delay to its root cause across tools
- Measure whether AI is adding velocity or rework
- Rebalance capacity before teams overload
- Walk into leadership meetings with confident answers
Cost capitalization runs on numbers nobody trusts.
Engineers hate timesheets and AI agents are coding everything, so you end up estimating allocation with bad project data.
- Chasing engineers for timesheets or estimates
- Estimating capitalizable work from bad data
- Defending allocations you can't trace
- Losing the month-end close to manual cleanup
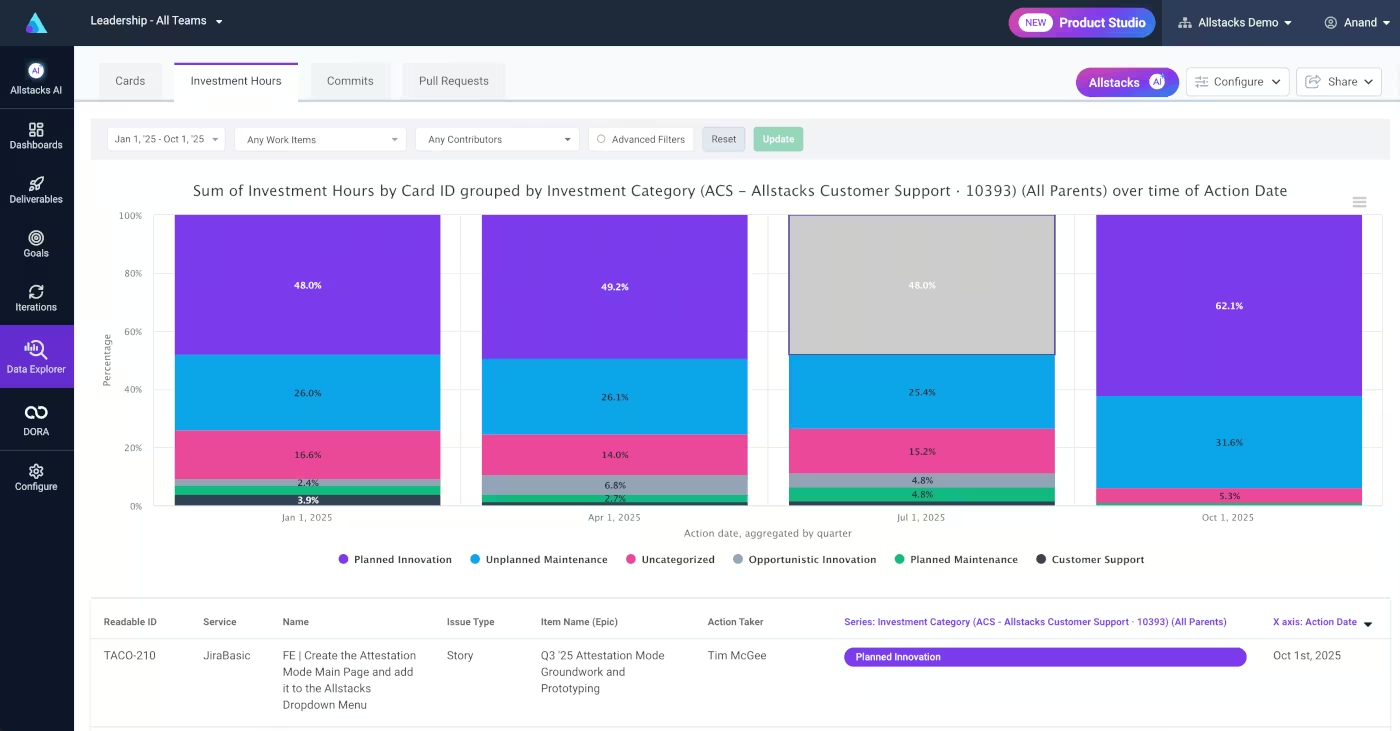
Classify capitalizable work continuously with accuracy.
An audit-ready cost capitalization report based on real work, applied against your capitalization rules, mapped to individuals and projects.
- Skip timesheets entirely
- Map spend to initiatives automatically
- Produce audit-ready reports on demand
- Cut the month-end close time
/ our solutions /
/ resources /

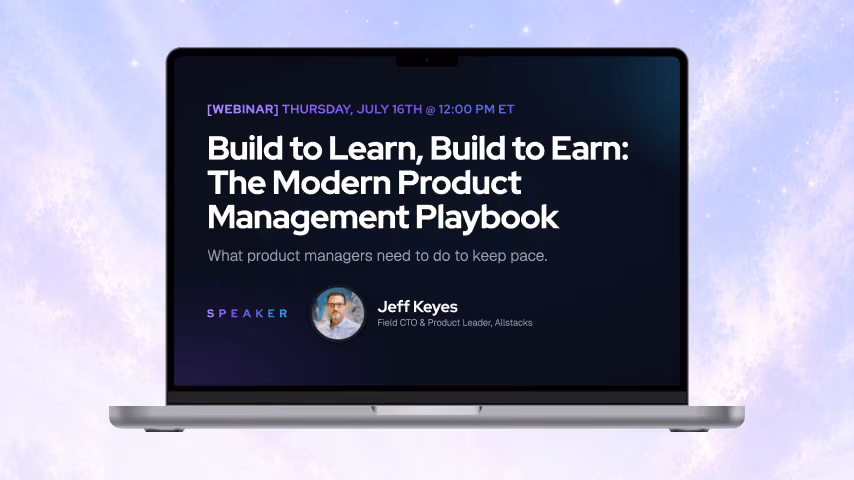
The Modern Product Management Playbook
Allstacks Field CTO Jeff Keyes on the operating model product managers need now that AI builds at machine speed.
The AI Transformation of Software Product Management
Why the product manager's role is changing under AI, and the skills that matter now.
Measuring AI's Impact on Engineering
Five KPIs that show whether your AI investment is paying off or piling up rework.
Software R&D Capitalization: The Ultimate Guide
How to make R&D capitalization continuous and audit-ready, without the timesheets.
/ customer outcomes /
32%
Progress Software cut cycle time by a third across 40 teams
3x
Ndustrial tripled developer velocity and saved 120 hours per quarter on reporting
30%
A public infrastructure software company cut bug resolution time by nearly a third
70%
Enverus completed their capitalization reports nearly three quarters faster
/ use cases /
Research and define products and features.
Ideate on products and features with business and technical context automatically surfaced.
Refine epics and tickets before sprints.
Review complete initiatives, epics, and tickets for engineering readiness.
Manage delivery risk.
Surface delays and dependencies before they become missed commitments.
Improve engineering performance.
Industry benchmarks and workflow-driven recommendations.
Align investment to initiatives.
Match where engineering time goes to what's actually planned.
Measure AI coding impact.
AI tool and token usage correlated with delivery metrics and costs to understand impacts
Automate software cost capitalization.
Audit-ready capitalization reports from development activity, no timesheets.
Measure developer productivity.
Productivity, output quality, and developer experience in one view.

/ customers /

Julian Limon
CTO, Co-founder

Nandini Easwar
CTIO

Chris Probert
Director of Engineering
Julian Limon
CTO, Co-founder
%2520Loggins.png)
Hannah (Haustein) Loggins
Accounting Manager

/ question & answers /
What is a software engineering intelligence platform?
A software engineering intelligence platform connects data from across your software delivery lifecycle and turns it into metrics, insights, and recommendations engineering leaders can act on. Allstacks is an agentic platform that ingests data from tools like Jira, GitHub, GitLab, and Jenkins, then uses AI agents to surface delivery risks and suggest next steps so teams can plan, measure, and improve how they ship software.
What are DORA metrics, and does Allstacks track them?
DORA metrics are four widely used measures of software delivery performance: deployment frequency, lead time for changes, change failure rate, and time to restore service. Allstacks calculates DORA metrics automatically from your existing tools and also supports the SPACE and Flow frameworks, so you can benchmark delivery health without manual data wrangling.
How is value stream intelligence different from value stream management?
Value stream management focuses on mapping and improving the flow of work, while value stream intelligence adds continuous, AI-driven analysis of that flow to explain why outcomes happen and what to do next. Allstacks builds a context graph across your SDLC tools so leaders can connect engineering work to business outcomes rather than simply visualize a pipeline.
What is value stream management?
Value stream management (VSM) is the practice of analyzing and improving the flow of work across software delivery, connecting engineering output to business outcomes.
What value stream insights does Allstacks provide?
Allstacks provides value stream insights like delivery forecasts, risk and bottleneck alerts, and traceability from business initiatives down to individual commits and pull requests. By unifying data from project management, code, and CI/CD tools, Allstacks gives leaders end-to-end visibility into how engineering work delivers customer value.
How does Allstacks measure developer productivity?
Allstacks measures developer productivity using balanced, framework-based metrics rather than a single output number, drawing on DORA, SPACE, and Flow signals across commits, reviews, and delivery. This gives engineering leaders a fuller picture of throughput, quality, and team health, and avoids the pitfalls of judging individuals on raw activity counts.
Can Allstacks measure the impact of AI coding tools?
Yes. Allstacks measures AI coding impact by analyzing how AI-assisted work moves through your delivery lifecycle, so you can see whether AI code assistants are improving speed, quality, and predictability. Because the platform normalizes data across your SDLC, leaders can compare AI-influenced work against historical baselines instead of relying on vendor claims.
Does Allstacks support software capitalization reporting?
Yes. Allstacks automates software capitalization (R&D cap) reporting by mapping engineering time, cost, and activity to projects and objectives, reducing the manual estimation work that finance and engineering teams usually share. This helps organizations produce auditable software cost capitalization records directly from delivery data.
How does Allstacks help teams act on engineering metrics and KPIs?
Allstacks goes beyond tracking engineering metrics and KPIs like flow metrics, cycle time, throughput, and the DORA and SPACE measures. Its AI agents analyze those signals in context to flag delivery risks and recommend next steps, so leaders spend less time reading dashboards and more time acting on what matters.
How does Allstacks forecast software delivery timelines?
Allstacks uses machine learning and historical delivery data to forecast completion dates, from portfolio initiatives down to individual Jira stories, and highlights the gap between target and forecasted dates. This engineering forecasting helps leaders manage delivery risk early and release more predictably.
/ get started /
